Noise regulation by quorum sensing in low mRNA copy number systems
- PMID: 21251314
- PMCID: PMC3037314
- DOI: 10.1186/1752-0509-5-11
Noise regulation by quorum sensing in low mRNA copy number systems
Abstract
Background: Cells must face the ubiquitous presence of noise at the level of signaling molecules. The latter constitutes a major challenge for the regulation of cellular functions including communication processes. In the context of prokaryotic communication, the so-called quorum sensing (QS) mechanism relies on small diffusive molecules that are produced and detected by cells. This poses the intriguing question of how bacteria cope with the fluctuations for setting up a reliable information exchange.
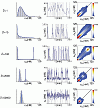
Results: We present a stochastic model of gene expression that accounts for the main biochemical processes that describe the QS mechanism close to its activation threshold. Within that framework we study, both numerically and analytically, the role that diffusion plays in the regulation of the dynamics and the fluctuations of signaling molecules. In addition, we unveil the contribution of different sources of noise, intrinsic and transcriptional, in the QS mechanism.
Conclusions: The interplay between noisy sources and the communication process produces a repertoire of dynamics that depends on the diffusion rate. Importantly, the total noise shows a non-monotonic behavior as a function of the diffusion rate. QS systems seems to avoid values of the diffusion that maximize the total noise. These results point towards the direction that bacteria have adapted their communication mechanisms in order to improve the signal-to-noise ratio.
Figures


Similar articles
-
Noise reduction by diffusional dissipation in a minimal quorum sensing motif.PLoS Comput Biol. 2008 Aug 29;4(8):e1000167. doi: 10.1371/journal.pcbi.1000167. PLoS Comput Biol. 2008. PMID: 18769706 Free PMC article.
-
Extracellular noise-induced stochastic synchronization in heterogeneous quorum sensing network.J Theor Biol. 2007 Apr 21;245(4):726-36. doi: 10.1016/j.jtbi.2006.12.006. Epub 2006 Dec 12. J Theor Biol. 2007. PMID: 17239902
-
Quorum sensing: A less known mode of communication among fungi.Microbiol Res. 2018 May;210:51-58. doi: 10.1016/j.micres.2018.03.007. Epub 2018 Mar 21. Microbiol Res. 2018. PMID: 29625658 Review.
-
Cell-cell communication by quorum sensing and dimension-reduction.J Math Biol. 2006 Oct;53(4):672-702. doi: 10.1007/s00285-006-0024-z. Epub 2006 Aug 5. J Math Biol. 2006. PMID: 16897015
-
Bacterial quorum sensing in symbiotic and pathogenic relationships with hosts.Biosci Biotechnol Biochem. 2018 Mar;82(3):363-371. doi: 10.1080/09168451.2018.1433992. Epub 2018 Feb 9. Biosci Biotechnol Biochem. 2018. PMID: 29424268 Review.
Cited by
-
Phenotypic memory in quorum sensing.PLoS Comput Biol. 2024 Jul 8;20(7):e1011696. doi: 10.1371/journal.pcbi.1011696. eCollection 2024 Jul. PLoS Comput Biol. 2024. PMID: 38976753 Free PMC article.
-
Slow protein fluctuations explain the emergence of growth phenotypes and persistence in clonal bacterial populations.PLoS One. 2013;8(1):e54272. doi: 10.1371/journal.pone.0054272. Epub 2013 Jan 29. PLoS One. 2013. PMID: 23382887 Free PMC article.
-
Physical communication pathways in bacteria: an extra layer to quorum sensing.Biophys Rev. 2025 Mar 4;17(2):667-685. doi: 10.1007/s12551-025-01290-1. eCollection 2025 Apr. Biophys Rev. 2025. PMID: 40376406 Free PMC article. Review.
-
The cellular Ising model: a framework for phase transitions in multicellular environments.J R Soc Interface. 2016 Jun;13(119):20151092. doi: 10.1098/rsif.2015.1092. J R Soc Interface. 2016. PMID: 27307510 Free PMC article.
-
Information transmission in microbial and fungal communication: from classical to quantum.J Cell Commun Signal. 2018 Jun;12(2):491-502. doi: 10.1007/s12079-018-0462-6. Epub 2018 Feb 23. J Cell Commun Signal. 2018. PMID: 29476316 Free PMC article.
References
-
- Güell M, van Noort V, Yus E, Chen WH, Leigh-Bell J, Michalodimitrakis K, Yamada T, Arumugam M, Doerks T, Kühner S, Rode M, Suyama M, Schmidt S, Gavin AC, Bork P, Serrano L. Transcriptome complexity in a genome-reduced bacterium. Science (New York, NY) 2009;326(5957):1268–71. - PubMed
-
- Kæ rn M, Elston T, Blake W, Collins J. Stochasticity in gene expression: from theories to phenotypes. Nature Reviews Genetics. 2005;6(6):451–464. http://www.nature.com/nrg/journal/v6/n6/abs/nrg1615.html - PubMed
-
- Süel GM, Garcia-Ojalvo J, Liberman LM, Elowitz MB. An excitable gene regulatory circuit induces transient cellular differentiation. Nature. 2006;440(7083):545–50. - PubMed
Publication types
MeSH terms
Substances
LinkOut - more resources
Full Text Sources

