. 2011 Jan 18;19(1):17-30.
doi: 10.1016/j.ccr.2010.12.014.

Oncometabolite 2-hydroxyglutarate is a competitive inhibitor of α-ketoglutarate-dependent dioxygenases

Affiliations

Oncometabolite 2-hydroxyglutarate is a competitive inhibitor of α-ketoglutarate-dependent dioxygenases

Wei Xu et al. Cancer Cell. .

Abstract

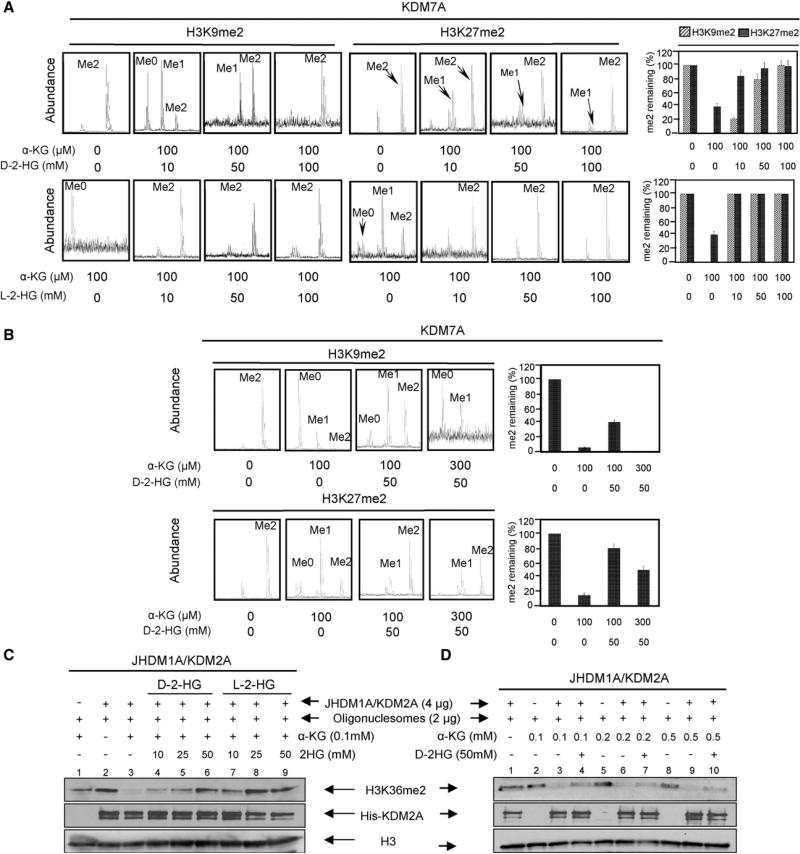
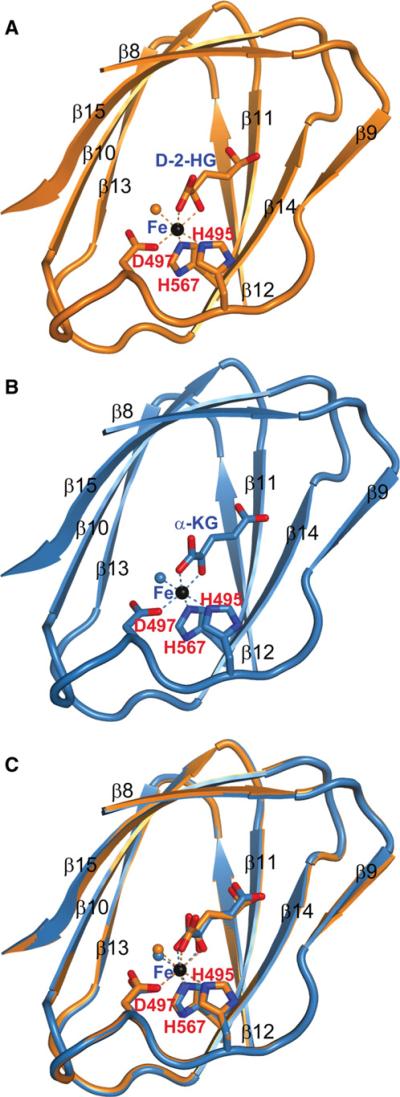
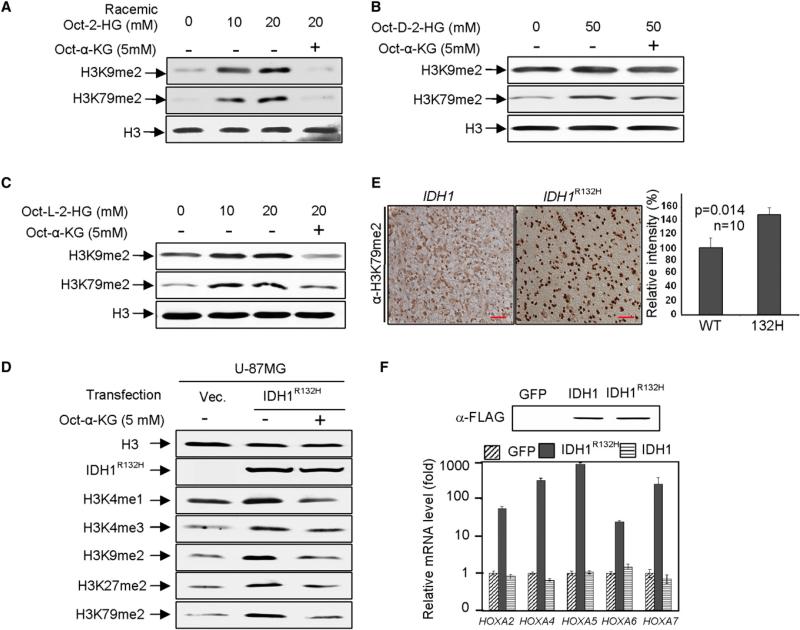
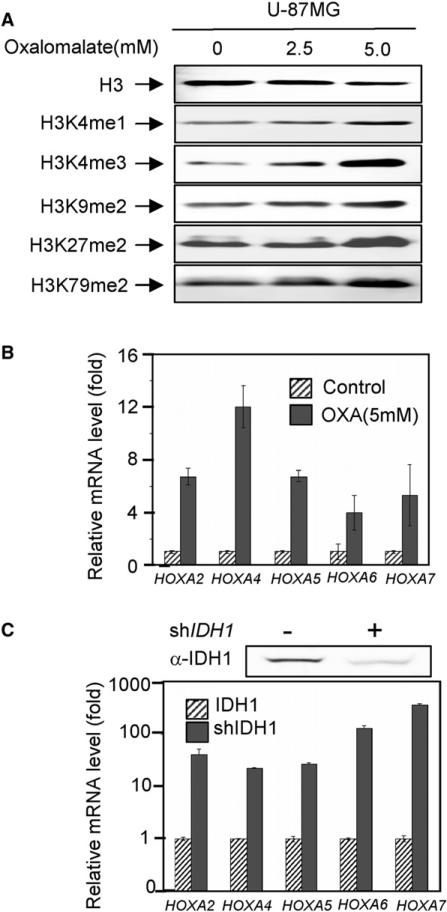
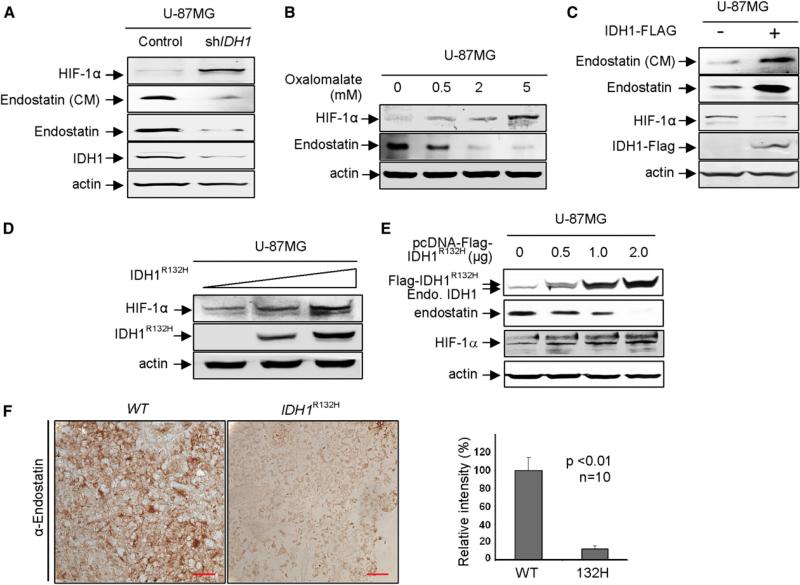
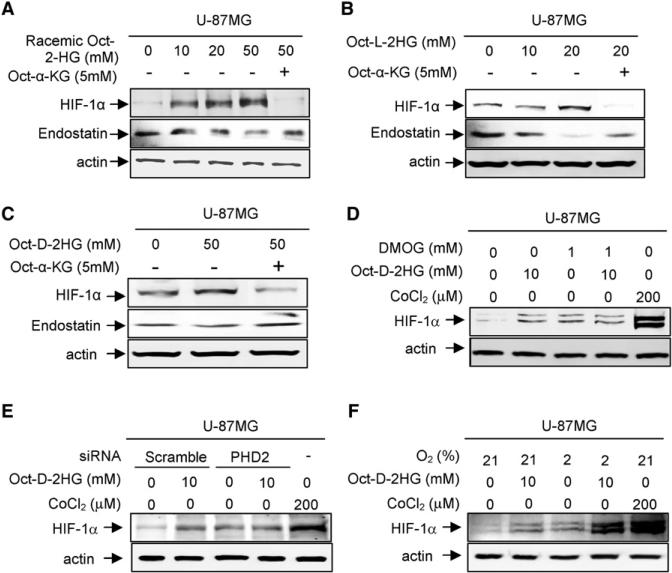
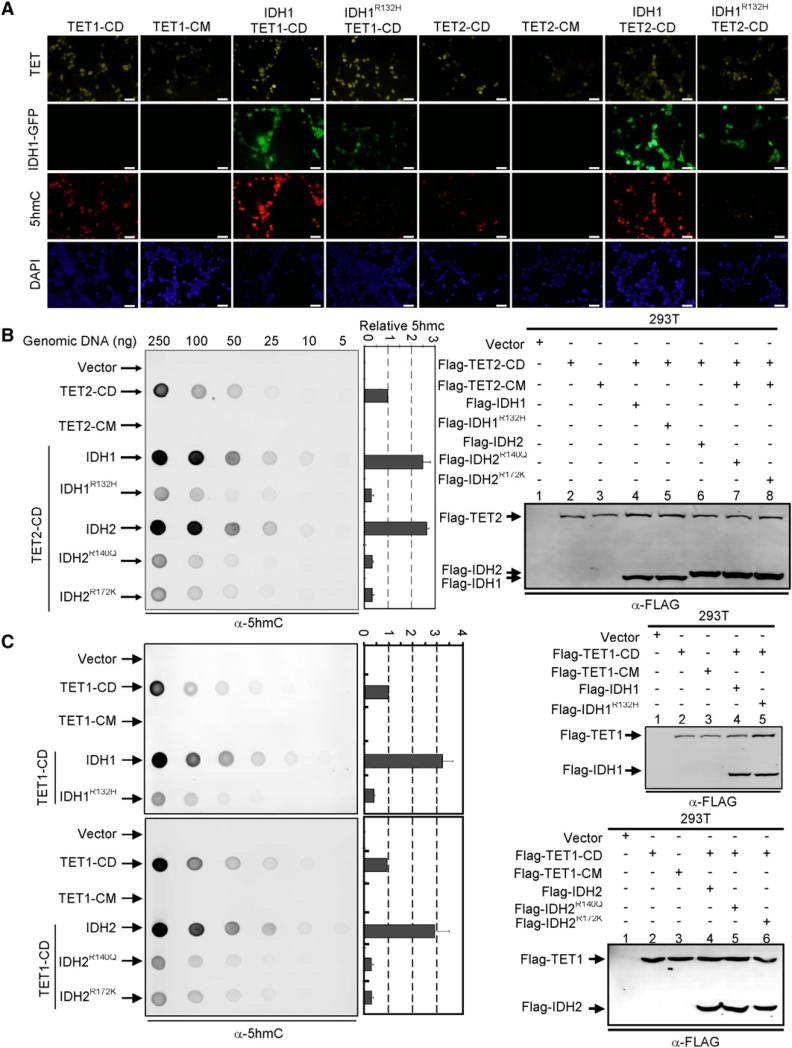
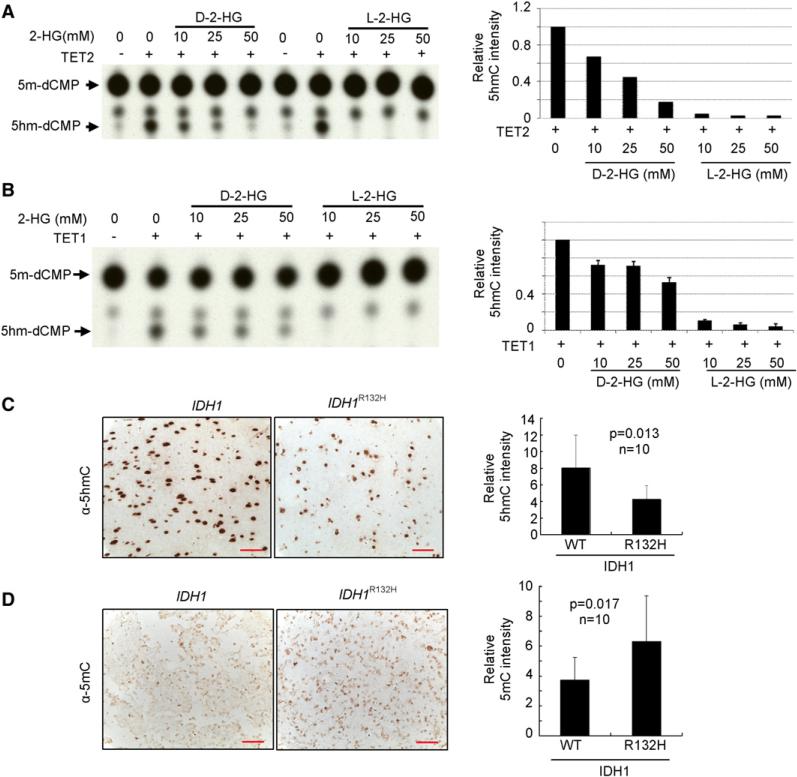
IDH1 and IDH2 mutations occur frequently in gliomas and acute myeloid leukemia, leading to simultaneous loss and gain of activities in the production of α-ketoglutarate (α-KG) and 2-hydroxyglutarate (2-HG), respectively. Here we demonstrate that 2-HG is a competitive inhibitor of multiple α-KG-dependent dioxygenases, including histone demethylases and the TET family of 5-methlycytosine (5mC) hydroxylases. 2-HG occupies the same space as α-KG does in the active site of histone demethylases. Ectopic expression of tumor-derived IDH1 and IDH2 mutants inhibits histone demethylation and 5mC hydroxylation. In glioma, IDH1 mutations are associated with increased histone methylation and decreased 5-hydroxylmethylcytosine (5hmC). Hence, tumor-derived IDH1 and IDH2 mutations reduce α-KG and accumulate an α-KG antagonist, 2-HG, leading to genome-wide histone and DNA methylation alterations.


Figures

Figure 1
Figure 1. 2-HG Is a Competitive Inhibitor of α-KG for Histone Demethylases
(A) 2-HG inhibits Caenorhabditis elegans KDM7A demethylase activity. CeKDM7A activities toward H3K9me2 and H3K27me2 peptides were assayed in the presence of increasing concentrations of either D-2-HG or L-2-HG as indicated. The demethylated products were analyzed by mass spectrometry (left) and mean activity values of duplicated assays, represented by percentage of remaining methylated peptides (right), are shown. Error bars represent ± standard deviation (SD) for triplicate experiments. (B) α-KG rescues 2-HG inhibition of CeKDM7A demethylase activity. Error bars represent ± SD for triplicate experiments. (C) 2-HG inhibits human JHDM1A/KDM2A demethylase activity. Purified recombinant JHDM1A demethylase activity was assayed in the presence of various concentrations of D-2-HG and L-2-HG as indicated. (D) α-KG reverses the inhibitory effect of D-2-HG on JHDM1A. JHDM1A activity was assayed in the presence of 50 mM D-2-HG and various concentrations of α-KG. See also Figure S1.
Figure 2
Figure 2. 2-HG and α-KG Bind to the Same Site in Histone Demethylases
(A) The structure of D-2-HG bound to CeKDM7A JmjC domain. D-2-HG and CeKDM7A are shown in stick and cartoon representation, respectively. Secondary structural elements of CeKDM7A are indicated. Fe (II) is colored in black, Fe (II) coordination is represented by dotted lines and water molecule is shown as orange ball. (B) The structure of α-KG bound to CeKDM7A JmjC domain, illustrated as in (A). (C) Superimposition of structures shown in (A) and (B). See also Figure S2.
Figure 3
Figure 3. Reduced Activity of IDH1 and Elevated 2-HG Increase Genome-Wide Histone Methylations and Alter Gene Expression
(A–C) Cell-permeable octyl-2-HG increases histone methylation. H3K9me2 and H3K79me2 levels of U-87MG cells treated with racemic octyl-2-HG (A), octyl-D-2-HG (B), and octyl- L-2-HG (C) were analyzed by western blotting. (D) Histone methylation increased by IDH1R132H overexpression can be rescued by addition of cell-permeable octyl-α-KG. Specified histone methylation levels of U-87MG cells expressing IDH1R132H were analyzed by western blotting. (E) Elevated H3K79 dimethylation in IDH1R132H gliomas. IDH1 wild-type or heterozygous for R132H glioma samples were subjected to IHC analysis for H3K79me2 methylation. Scale bars represent 50 μm. Shown are representative IHC results (left) and mean values of IHC quantification (right). Error bars represent ± SD for triplicate experiments. Complete results of all 20 samples are presented in Figure S3K. (F) Reduction of IDH1 activity activates HOXA genes. HOXA mRNA levels were analyzed by qRT-PCR in U-87MG cells after forced expression of wild-type or R132H mutant IDH1. Error bars represent ± SD for triplicate experiments. See also Figure S3.
Figure 4
Figure 4. INHIBITION of IDH1 Reduces Histone Demethylase Activities In Vivo
(A) Inhibition of IDH1 activity increases histone methylation. Specified histone methylation levels in U-87MG cells treated with increasing concentrations of oxalomalate were analyzed by western blotting. (B and C) Reduction of IDH1 activity activates HOXA genes. HOXA mRNA levels were analyzed by qRT-PCR in U-87MG cells after knocking down IDH1 (C), and treatment of oxalomalate (B). Error bars represent ± SD for triplicate experiments. See also Figure S4.
Figure 5
Figure 5. IDH1 Function Supports the Activity of α-KG-Dependent Dioxygenases In Vivo
(A–E) The effects of reducing or increasing IDH1 function on two α-KG-dependent dioxygenases, PHDs and C-P4H, were examined in U-87MG cells after knockdown IDH1 (A), treatment of oxalomalate, a competitive inhibitor of IDH1 (B), overexpression of wild-type IDH1 (C), and tumor-derived IDH1R132H mutant (D and E). The protein levels of HIF-1α, endostatin, and ectopically and endogenously expressed IDH1 were determined by western blotting. (F) Decreased endostatin in IDH1R132H gliomas. IDH1 wild-type or heterozygous for R132H glioma samples were subjected to IHC analysis for endostatin. Shown are representative IHC results (left) and mean values of IHC quantification (right). Scale bars represent 50 μm. Error bars represent ± SD for triplicate experiments. Complete results of all 20 samples are presented in Figure S5C. See also Figure S5.
Figure 6
Figure 6. 2-HG Inhibits the Activity of α-KG-Dependent Dioxygenases In Vivo
(A–C) Cell-permeable 2-HG increases HIF-1α and decreases endostatin. U-87MG cells were treated with racemic octyl-2-HG (A), octyl-L-2-HG (B), and octyl-D-2-HG (C). The steady state levels of endostatin and HIF-1α proteins were determined by direct western blotting. (D) DMOG treatment abolishes 2-HG effect on HIF-1α induction. (E) PHD2 knock down abolishes 2-HG effect on HIF-1α induction. (F) 2-HG treatment further induces HIF-1α in hypoxic U-87MG cells. See also Figure S6.
Figure 7
Figure 7. Tumor-Derived IDH1 and IDH2 Mutants Inhibit the 5hmC Production by TET1 and TET2
(A) HEK293 cells were transiently transfected with plasmids expressing indicated proteins. Thirty-six to forty hours after the transfection, cells were fixed and stained with antibodies specific to Flag to determine the expression of TET protein, to 5hmC to determine the levels of 5hmC, and to DAPI to view the cell nuclei or visualized for green fluorescence to determine the expression of IDH1 proteins. Scale bars represent 50 μm. Additional results on the inhibition of TET1 and TET2 function by IDH2 mutants are presented in Figures S7A and S7B. (B and C) HEK293 cells were transiently transfected as described in (A). Thirty-six to forty hours after the transfection, genomic DNAs were isolated from the transfected cells, spotted on nitrocellulose membranes and immunoblotted with an antibody specific to 5hmC. Quantification of 5hmC was calculated from three independent assays. The expression of individual proteins was determined by immunoblotting as shown in the right. One representative quantification of 5hmC level determined from the assays using 50 ng genomic DNA is included and the rest of the quantifications are presented in Figures S7C–S7E. Error bars represent ± SD for triplicate experiments. See also Figure S7.
Figure 8
Figure 8. Glioma Harboring Mutant IDH1 Have Decreased 5hmC
(A and B) Recombinant catalytic domains and corresponding catalytic mutants of murine TET2 (A) or TET1 (B) protein was produced and purified from insect Sf9 cells, and incubated with double-stranded DNA oligonucleotides containing a fully methylated MspI site in the presence of Fe (II) and α-KG (0.1 mM). Recovered oligonucleotides were digested with MspI, end labeled with T4 DNA kinase, digested with DNaseI and phosphodiesterase, and analyzed by TLC. Error bars represent ± SD for triplicate experiments. (C) IDH1 wild-type or heterozygous for R132H glioma samples were subjected to IHC analysis for 5hmC. Shown are representative IHC results (left) and mean values of IHC quantification (right). Scale bars represent 50 μm. Error bars represent ± SD for triplicate experiments. Complete results of all 20 samples are presented in Figure S8A. (D) IDH1 wild-type or heterozygous for R132H glioma samples were subjected to IHC analysis for 5mC. Scale bars represent 50 μm. Shown are representative IHC results (left) and mean values of IHC quantification (right). Error bars represent ± SD for triplicate experiments. Complete results of all 20 samples are presented in Figure S8B.

References

    1. Aghili M, Zahedi F, Rafiee E. Hydroxyglutaric aciduria and malignant brain tumor: a case report and literature review. J. Neurooncol. 2009;91:233–236. - PubMed
    1. Baysal BE, Ferrell RE, Willett-Brozick JE, Lawrence EC, Myssiorek D, Bosch A, van der Mey A, Taschner PE, Rubinstein WS, Myers EN, et al. Mutations in SDHD, a mitochondrial complex II gene, in hereditary paraganglioma. Science. 2000;287:848–851. - PubMed
    1. Bruick RK, McKnight SL. A conserved family of prolyl-4-hydroxylases that modify HIF. Science. 2001;294:1337–1340. - PubMed
    1. Chen Z, Zang J, Whetstine J, Hong X, Davrazou F, Kutateladze TG, Simpson M, Mao Q, Pan CH, Dai S, et al. Structural insights into histone demethylation by JMJD2 family members. Cell. 2006;125:691–702. - PubMed
    1. Clifton IJ, McDonough MA, Ehrismann D, Kershaw NJ, Granatino N, Schofield CJ. Structural studies on 2-oxoglutarate oxygenases and related double-stranded beta-helix fold proteins. J. Inorg. Biochem. 2006;100:644–669. - PubMed

Publication types

MeSH terms

Substances