. 2011 Jan 18;19(1):72-85.
doi: 10.1016/j.ccr.2010.11.011.

Endogenous T cell responses to antigens expressed in lung adenocarcinomas delay malignant tumor progression

Affiliations

Endogenous T cell responses to antigens expressed in lung adenocarcinomas delay malignant tumor progression

Michel DuPage et al. Cancer Cell. .

Abstract

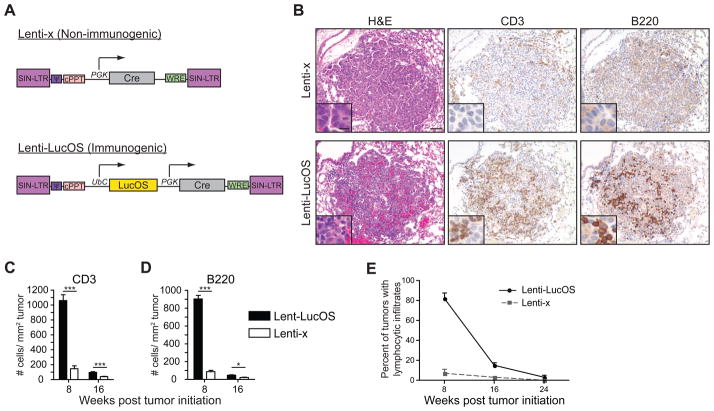
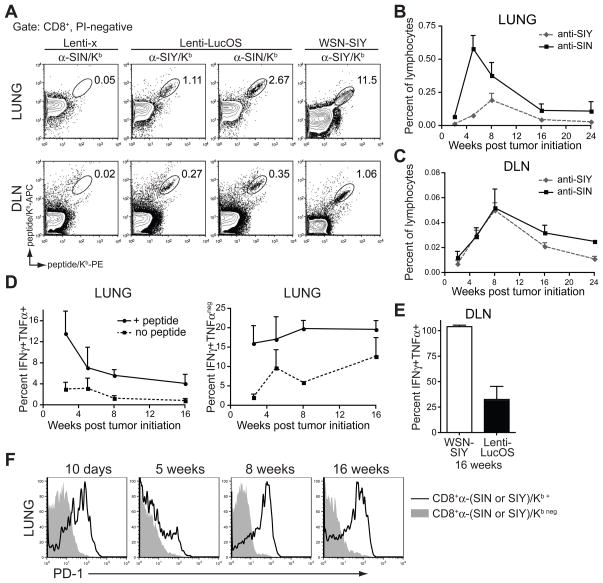
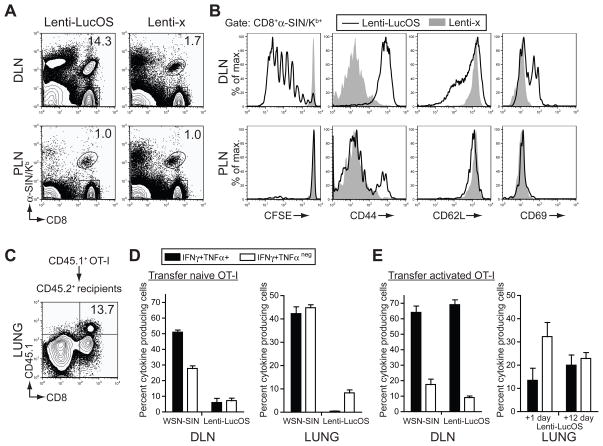
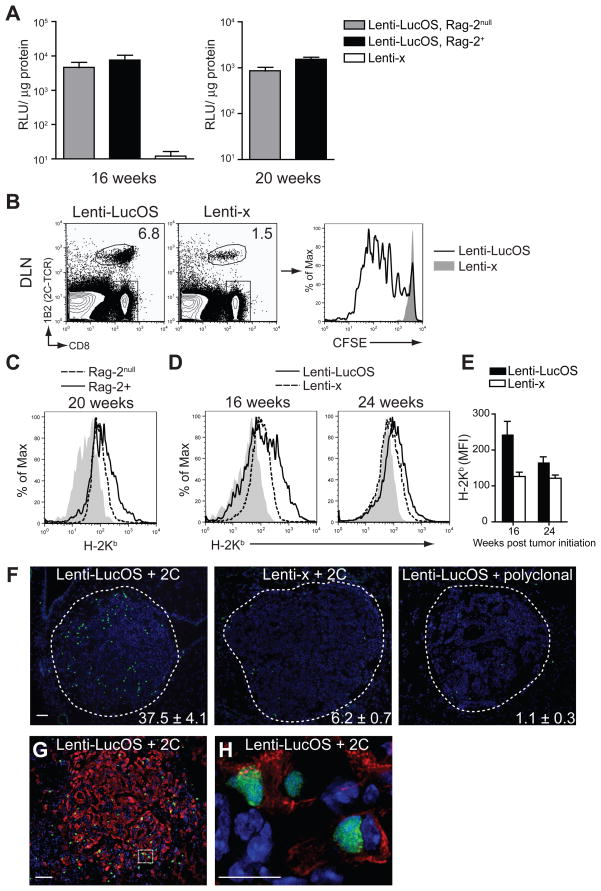
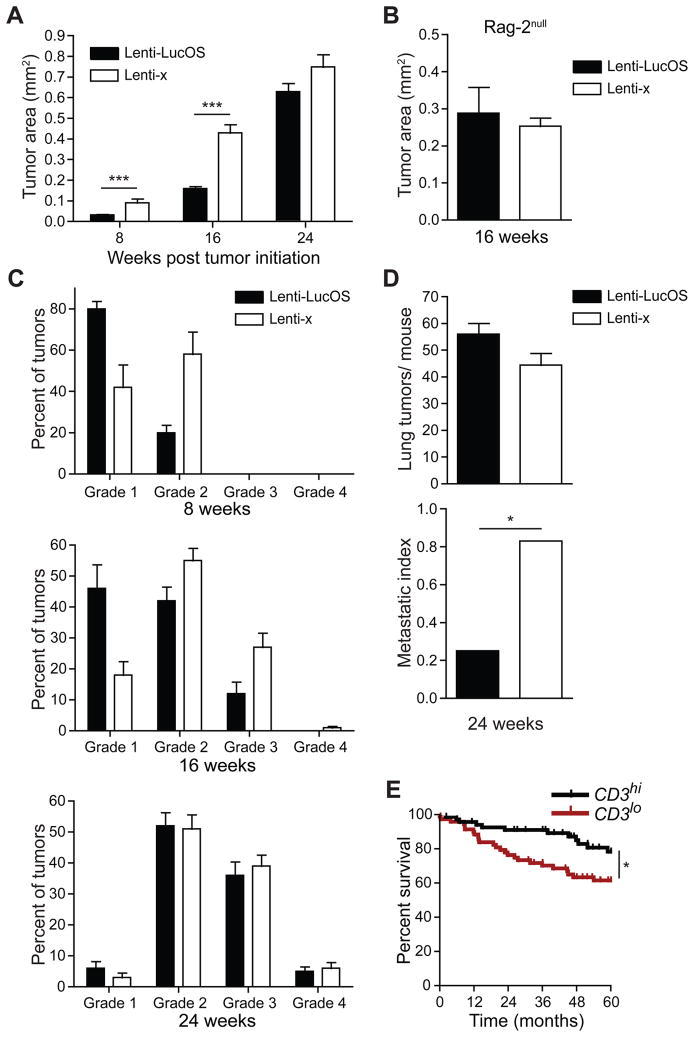
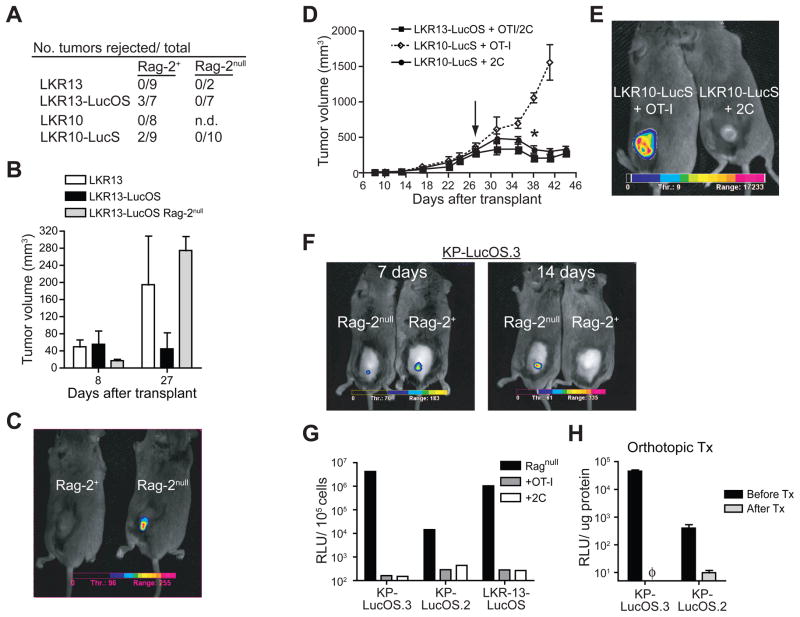
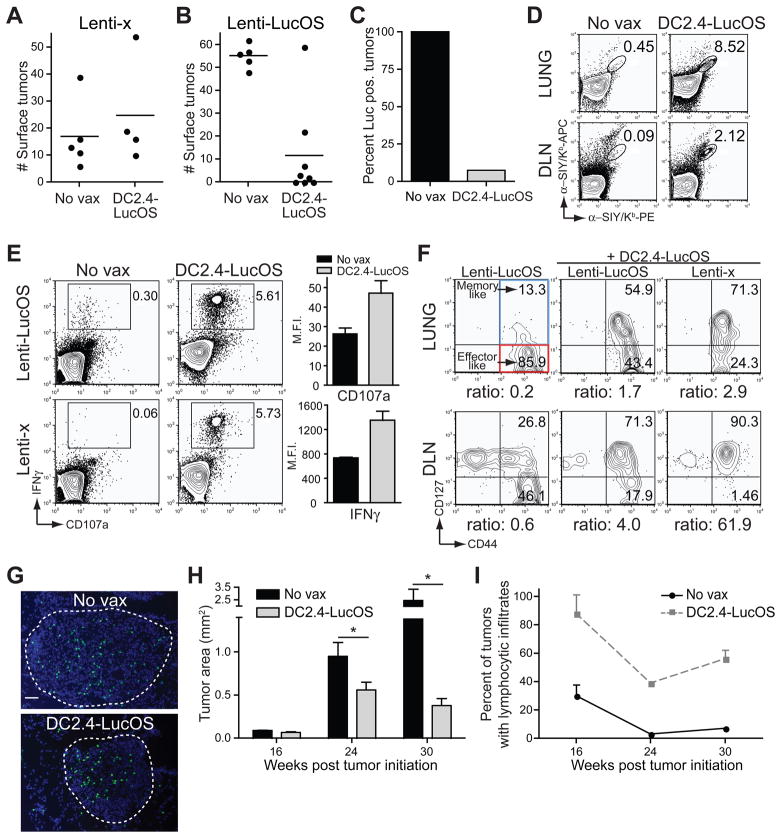
Neoantigens derived from somatic mutations in tumors may provide a critical link between the adaptive immune system and cancer. Here, we describe a system to introduce exogenous antigens into genetically engineered mouse lung cancers to mimic tumor neoantigens. We show that endogenous T cells respond to and infiltrate tumors, significantly delaying malignant progression. Despite continued antigen expression, T cell infiltration does not persist and tumors ultimately escape immune attack. Transplantation of cell lines derived from these lung tumors or prophylactic vaccination against the autochthonous tumors, however, results in rapid tumor eradication or selection of tumors that lose antigen expression. These results provide insight into the dynamic nature of the immune response to naturally arising tumors.


Figures

Figure 1
Figure 1. Induction of lung tumors using lentiviral vectors
(A) Design of Lenti-x and Lenti-LucOS (SIN-LTR: self-inactivating long terminal repeat, ψ: HIV packaging signal, cPPT: central polypurine tract, PGK: phosphoglycerate kinase promoter, WRE: woodchuck post-transcriptional regulatory element, UbC: ubiquitin C promoter). (B) Lung tumors induced with Lenti-x or Lenti-LucOS were stained with H&E, anti-CD3, or anti-B220, 8 weeks after tumor initiation. Scale = 50μm (inset 10μm). (C and D) Quantification of immune infiltrates by IHC for CD3 and B220 8 and 16 weeks post tumor initiation. p-values are ~10−8, and ~10−3 for CD3 and ~10−15 and 0.02 for B220 at 8 and 16 weeks, respectively. n= 2–5 mice, 16–100 tumors, per group. (E) Percent of lung tumors/mouse containing infiltrating lymphocytes at 8, 16, and 24 weeks after tumor initiation. n= 9–22 mice, 49–1594 tumors, per group. Data are mean ± SEM. See also Figure S1.
Figure 2
Figure 2. T cell responses to tumor antigens are generated but not sustained
(A) Representative analysis of SIY and SIN specific CD8+ T cells in the lung and the draining mediastinal lymph node (DLN) of Lenti-x or Lenti-LucOS tumor-bearing mice or WSN-SIY infected mice using peptide-loaded Kb reagents. FACS plots are gated on PI-negative, CD8+ cells. (B and C) Percent of lymphocytes specific for SIN or SIY during Lenti-LucOS tumor progression in the lung or DLN. The percent of anti-SIN or anti-SIY reactive cells (of total lymphocytes) was determined as shown in Figure S2A. n= 2–5 mice per time-point. (D) IFNγ and TNFα cytokine production in SIY and SIN-reactive T cells from the lungs of Lenti-LucOS tumor-bearing mice at several time points after tumor initiation. The percentage of SIY and SIN-specific T cells from the lungs that were IFN-γ+TNF-α+ or IFN-γ+TNF-αneg in the absence (no peptide) or in the presence of SIY and SIN peptides (+ peptide) is shown. Percentages were determined by staining duplicate samples for either DimerX or cytokine production as described in Figure S2L. n= 2–7 mice per time-point. (E) The percentage of SIY and SIN-specific T cells in the DLN that were IFN-γ+TNF-α+ 16 weeks after tumor initiation with Lenti-LucOS or WSN-SIY infection. n= 4 mice per group. (F) PD-1 surface expression on anti-SIY/Kb+ and anti-SIN/Kb+ CD8+ cells (open histograms) or non-specific CD8+ cells (filled histograms) from the lungs of Lenti-LucOS tumor-bearing mice at several time-points after tumor initiation. n= 2–3 mice per group. Data are mean ± SEM. See also Figure S2.
Figure 3
Figure 3. Adoptively transferred T cells are not fully functional in response to established tumors
(A) FACS analysis comparing the accumulation of SIN-reactive, OT-I T cells in the mediastinal DLN and the inguinal peripheral lymph nodes (PLN) three days after adoptive transfer of naïve OT-I cells into Lenti-x or Lenti-LucOS tumor-bearing mice 10 weeks after tumor initiation (similar results observed four weeks after tumor initiation). Percent of total CD8+ cells that are anti-SIN/Kb+ is indicated. n≥ 3 mice for Lenti-LucOS or ≥1 mouse for Lent-x tumor-bearing mice in each of two independent experiments. (B) Histogram plots of CD8+anti-SIN/Kb+ gated cells for CFSE dilution or surface expression of CD44, CD62L, or CD69 from the DLN or PLN of Lenti-LucOS (open histogram) or Lenti-x (filled histogram) tumor-bearing mice. Undivided (CFSEhi) CD8+anti-SIN/Kb+ cells were examined in CD69 plots to detect initial T cell activation. n≥ 3 mice for Lenti-LucOS or ≥1 mouse for Lent-x tumor-bearing mice in each of two independent experiments. (C) FACS analysis for the presence of OT-I T cells in the lungs of Lenti-LucOS tumor-bearing mice 12 days after adoptive transfer of naïve CD45.1+ OT-I T cells (tumor-bearing mice were CD45.2+). n≥ 3 mice in at least three independent experiments. (D) Percent of CD8+CD45.1+ gated OT-I T cells producing IFNγ+TNFα+ or IFNγ+TNFαneg from the DLN or lung after transfer of naïve OT-I T cells. WSN-SIN represents analysis of OT-I T cells 7 days after WSN-SIN infection. Lenti-LucOS represents analysis of OT-I T cells 12 days after transfer into Lenti-LucOS tumor-bearing mice between 12 and 16 weeks after tumor initiation. n= 6–7 mice per group. (E) Percent of CD8+CD45.1+ gated OT-I T cells producing IFNγ+TNFα+ or IFNγ+TNFαneg from the DLN or lung after transfer of in vitro-activated OT-I T cells. Lenti-LucOS represents analysis one day (lung only, n= 6 mice) and 12 days after transfer (n= 3 mice) into Lenti-LucOS tumor-bearing mice between 10 and 14 weeks after tumor initiation. WSN-SIN in the DLN represents analysis of naïve OT-I T cells 14 days after WSN-SIN infection (n= 3 mice). Data are mean ± SEM. See also Figure S3.
Figure 4
Figure 4. Antigen expression and presentation is maintained in tumors
(A) Luciferase activity (RLU/μg protein) in tumor lysates from K-rasLSL-G12D/+;p53fl/fl or K-rasLSL-G12D/+;p53fl/fl;Rag-2−/− mice at 16 or 20 weeks after tumor initiation. n= 8–14 tumors per mouse per group. (B) FACS analysis comparing the accumulation of SIY-reactive, 2C T cells in the DLN three days after adoptive transfer of naïve 2C cells into Lenti-x (n= 1) or Lenti-LucOS (n= 3) tumor-bearing mice 24 weeks after tumor initiation. CFSE dilution of CD8+1B2+ cells in mice with Lenti-LucOS (open histogram) or Lenti-x (filled histogram) tumors. (C) Freshly isolated Lenti-LucOS tumors generated in Rag-2null (dashed line) and Rag-2+ mice (solid line) 20 weeks after tumor initiation were pooled and compared by FACS analysis for H-2Kb surface expression after gating-out cells positive for CD45, CD31, Ter119, and IA/IE (MHCII). Plots representative of three pooled tumor samples from Rag-2null or Rag-2+ mice. Filled histogram is a negative control stain for CD8. (D) Freshly isolated Lenti-LucOS (solid line) and Lenti-x tumors (dashed line) at 16 and 24 weeks after tumor initiation compared by FACS analysis for H-2Kb surface expression as in C. Plots representative of pooled and individual tumor samples from two independent experiments. Filled histograms are negative control stains for H-2Kd. (E) H-2Kb mean fluorescent intensity on Lenti-LucOS and Lenti-x tumors at 16 and 24 weeks after tumor initiation. n= 2–3 mice, 6–11 tumor samples per group per time-point. (F) Activated 2C T cells, or α-CD3/CD28 activated polyclonal CD8+ T cells, labeled with CFSE were transferred into Lenti-LucOS or Lenti-x tumor-bearing mice 16 weeks post tumor initiation and tumors were analyzed for the presence of CFSE+ cells (green) 24 hours later. DAPI counter stained. Tumors are outlined and quantification of the number of CFSE+ cells/tumor is indicated. Scale = 50μm. n= 2–4 mice, 21–38 tumors, per group. (G) Cytokeratin 8 (red) stained Lenti-LucOS tumors from F that received activated CFSE+ 2C T cells (green) 16 weeks after tumor initiation. Scale = 50μm. (H) High magnification of box outlined in G. Scale = 10μm. Data are mean ± SEM. See also Figure S4.
Figure 5
Figure 5. Immunogenic tumors have delayed tumor progression
(A) Tumor area of Lenti-LucOS and Lenti-x lung tumors at 8, 16, and 24 weeks after tumor initiation. p-values are ~10−10, ~10−14, and ~0.108, respectively, from n= 9–15 mice, 44–892 tumors, per group. (B) Tumor area of Lenti-LucOS and Lenti-x lung tumors in K-rasLSL-G12D/+;p53fl/fl;Rag-2−/− mice 16 weeks after tumor initiation. p ~0.561 from n= 6–7 mice, 45–223 tumors, per group. (C) Tumor grades for Lenti-LucOS and Lenti-x lung tumors at 8, 16 and 24 weeks after tumor initiation. n= 9–22 mice, 49–1594 tumors, per group. (D) The number of lung tumors/mouse and metastatic index (number of mice with detectable metastases/total examined, p < 0.02) in Lenti-LucOS and Lenti-x tumor-bearing mice 24 weeks after tumor initiation. n= 8–12 mice per group. (E) Kaplan-Meyer plot comparing the survival of Stage I/II (lymph node metastases free, N0) lung adenocarcinoma patients with high or low CD3 expression in tumors. Patients were ranked from highest to lowest based on CD3 expression in tumors (average expression of CD3δ, CD3γ, CD3ε, and CD247 (CD3ζ)) and the top versus bottom quartiles were compared, p < 0.02. Data are mean ± SEM. See also Figure S5.
Figure 6
Figure 6. Transplanted lung tumors induce strong T cell responses that force tumor elimination or tumor antigen loss
(A) Number of tumors rejected of the total transplanted subcutaneously into immune-competent or immune-compromised (Rag-2null) 129S4/SvJae mice (n.d.= not done). Results are cumulative from three independent experiments and transplantation of 105–106 cells. (B) Size of LKR13 and LKR13-LucOS tumors 8 and 27 days after subcutaneous transplantation into immune-competent 129S4/SvJae mice or LKR13-LucOS into Rag-2null 129S4/SvJae mice. LKR13-LucOS tumors that were rejected are not included. Results are cumulative from three independent experiments. n= 2–5 mice per group. (C) Representative in vivo luciferase activity of LKR10-LucS or LKR13-LucOS tumors transplanted subcutaneously into Rag-2+ or Rag-2null 129S4/SvJae mice. (n= 23 mice, 6–7 LKR10-LucS, 4–6 LKR13-LucOS per group). (D) Tumor growth after subcutaneous transplantation of LKR10-LucS or LKR13-LucOS into Rag-2null mice followed by transfer of naïve OT-I or 2C T cells (arrow) and measurement of luciferase activity (star) (OTI/2C = OT-I or 2C transfer). n= 3–4 mice per group. (E) Representative in vivo luciferase activity of LKR10-LucS tumors in Rag-2null mice that received OT-I or 2C T cells from D. All LKR13-LucOS tumors lost detectable luciferase activity with transfer of OT-I or 2C T cells. (F) Representative in vivo luciferase activity 7 and 14 days after subcutaneous transplantation of a Lenti-LucOS induced lung tumor cell line (KP-LucOS.3) into Rag-2null or Rag-2+ 129S4/SvJae mice. (G) Similar to D, Lenti-LucOS induced lung tumor cell lines (KP-LucOS.3 and KP-LucOS.2) or LKR13-LucOS were transplanted subcutaneously into Rag-2null mice, then OT-I, 2C, or no T cells were transferred and luciferase activity was measured in tumor cell lines generated from the tumors >28 days after transplantation. (H) Lenti-LucOS induced lung tumor cell lines were orthotopically transplanted into 129S4/SvJae mice and luciferase activity in the grafted lung tumors was assayed and compared to the activity before transplantation (φ = nzot detectable). Data are mean ± SEM. See also Figure S6.
Figure 7
Figure 7. Vaccination in autochthonous lung tumor model reduces tumor burden and promotes loss of antigen expression
(A and B) Tumor number on the lungs of mice with Lenti-x or Lenti-LucOS tumors 16 weeks after tumor initiation with or without prior DC2.4-LucOS vaccination. p-values are ~0.50 and ~0.0008, respectively. (C) Freshly explanted Lenti-LucOS tumors were assayed for luciferase activity and the percent of tumors that were luciferase positive (> 50 RLU/μg protein) +/- DC2.4-LucOS vaccination is plotted. n= 5–6 mice, 27–34 tumors, per group. (D) Representative FACS plots of SIY/Kb-specific T cells (gated on CD8) from the lung and DLN +/- DC2.4-LucOS vaccination, 9 days after tumor initiation with Lenti-LucOS. n≥ 2 mice per group. (E) FACS for surface-exposed CD107a and captured IFNγ (gated on CD8) after stimulation of DLN cells with SIY and SIN from Lenti-LucOS or Lenti-x tumor-bearing mice +/− DC2.4-LucOS vaccination (16 weeks post tumor initiation). Mean fluorescent intensities of CD107a and IFNγ on reactive T cells is plotted. n= 2–4 mice per group. (F) FACS analysis of CD8+ anti-SIY/Kb+- and anti-SIN/Kb+-specific T cells for CD127 and CD44 surface expression from the lungs or DLN of Lenti-LucOS or Lenti-x tumor-bearing mice +/− DC2.4-LucOS vaccination (8 weeks post tumor initiation, n= 2–3 mice per group). The ratio of CD44+CD127+ (memory-like) to CD44+CD127 (effector-like) is shown below each FACS plot. (G) Lenti-LucOS tumors from mice 8 weeks after tumor initiation and 24 hours after transfer of SIY-reactive, CFSE-labeled activated T cells (green) +/− DC2.4-LucOS vaccination. DAPI counter stained. Tumors are outlined. Scale = 50μm. (H) Mean tumor area of Lenti-LucOS lung tumors at 16, 24 and 30 weeks after tumor initiation +/− DC2.4-LucOS vaccination. p-values are ~0.050, ~0.038, and ~0.027, respectively, from n= 3–10 mice, 70–506 tumors, per group at 16 and 24 weeks, and n= 1–2 mice, 15–46 tumors, per group at 30 weeks. (I) Percent of Lenti-LucOS tumors/mouse containing infiltrating lymphocytes at 16, 24 and 30 weeks after tumor initiation +/− DC2.4-LucOS vaccination (analysis of mice from H). Data are mean ± SEM. See also Figure S7.

References

    1. Bai A, Higham E, Eisen HN, Wittrup KD, Chen J. Rapid tolerization of virus-activated tumor-specific CD8+ T cells in prostate tumors of TRAMP mice. Proc Natl Acad Sci U S A. 2008;105:13003–13008. - PMC - PubMed
    1. Buckanovich RJ, Facciabene A, Kim S, Benencia F, Sasaroli D, Balint K, Katsaros D, O’Brien-Jenkins A, Gimotty PA, Coukos G. Endothelin B receptor mediates the endothelial barrier to T cell homing to tumors and disables immune therapy. Nat Med. 2008;14:28–36. - PubMed
    1. Bucks CM, Norton JA, Boesteanu AC, Mueller YM, Katsikis PD. Chronic antigen stimulation alone is sufficient to drive CD8+ T cell exhaustion. J Immunol. 2009;182:6697–6708. - PMC - PubMed
    1. Budhu A, Forgues M, Ye QH, Jia HL, He P, Zanetti KA, Kammula US, Chen Y, Qin LX, Tang ZY, Wang XW. Prediction of venous metastases, recurrence, and prognosis in hepatocellular carcinoma based on a unique immune response signature of the liver microenvironment. Cancer Cell. 2006;10:99–111. - PubMed
    1. Calzascia T, Pellegrini M, Hall H, Sabbagh L, Ono N, Elford AR, Mak TW, Ohashi PS. TNF-alpha is critical for antitumor but not antiviral T cell immunity in mice. J Clin Invest. 2007;117:3833–3845. - PMC - PubMed

Publication types

MeSH terms