. 2011 Mar 17;117(11):3076-86.
doi: 10.1182/blood-2010-08-301507. Epub 2011 Jan 20.

Development of human CD4+FoxP3+ regulatory T cells in human stem cell factor-, granulocyte-macrophage colony-stimulating factor-, and interleukin-3-expressing NOD-SCID IL2Rγ(null) humanized mice

Affiliations

Development of human CD4+FoxP3+ regulatory T cells in human stem cell factor-, granulocyte-macrophage colony-stimulating factor-, and interleukin-3-expressing NOD-SCID IL2Rγ(null) humanized mice

Eva Billerbeck et al. Blood. .

Abstract

Human hematolymphoid mice have become valuable tools for the study of human hematopoiesis and uniquely human pathogens in vivo. Recent improvements in xenorecipient strains allow for long-term reconstitution with a human immune system. However, certain hematopoietic lineages, for example, the myeloid lineage, are underrepresented, possibly because of the limited cross-reactivity of murine and human cytokines. Therefore, we created a nonobese diabetic/severe combined immunodeficiency/interleukin-2 receptor-γ-null (NOD-SCID IL2Rγ(null)) mouse strain that expressed human stem cell factor, granulocyte-macrophage colony-stimulating factor, and interleukin-3, termed NSG-SGM3. Transplantation of CD34(+) human hematopoietic stem cells into NSG-SGM3 mice led to robust human hematopoietic reconstitution in blood, spleen, bone marrow, and liver. Human myeloid cell frequencies, specifically, myeloid dendritic cells, were elevated in the bone marrow of humanized NSG-SGM3 mice compared with nontransgenic NSG recipients. Most significant, however, was the increase in the CD4(+)FoxP3(+) regulatory T-cell population in all compartments analyzed. These CD4(+)FoxP3(+) regulatory T cells were functional, as evidenced by their ability to suppress T-cell proliferation. In conclusion, humanized NSG-SGM3 mice might serve as a useful model to study human regulatory T-cell development in vivo, but this unexpected lineage skewing also highlights the importance of adequate spatiotemporal expression of human cytokines for future xenorecipient strain development.


Figures

Figure 1
Figure 1
Peripheral human immune system reconstitution in HIS versus HIS-SGM3 mice. HIS mice and HIS-SGM3 mice were generated by transplantation of human CD34+ HSCs into newborn NSG (NOD/SCID/IL2Rγnull) mice and NSG mice transgenic for human GM-CSF, IL-3, and SCF (NSG-SGM3). Eight and 12 weeks after transplantation, blood was analyzed for human immune system reconstitution by flow cytometry. (A) Isolated leukocytes from HIS (◇) and HIS-SGM3 (♦) mice were counterstained with anti-mouse CD45 and anti-human CD45 antibodies to determine the overall human immune cell chimerism. Within the human CD45+ cell population, the frequency of T cells (B), B cells (C), and myeloid cells (D) in HIS versus HIS-SGM3 mice was determined. (E) Representative fluorescence-activated cell sorter dot plots. Unpaired Student t test: *P ≤ .05; **P ≤ .005; ***P ≤ .0001.
Figure 2
Figure 2
Human immune system reconstitution in spleen, liver, and bone marrow of HIS versus HIS-SGM3 mice. Twelve weeks after human CD34+ HSC engraftment, various organs from HIS and HIS-SGM3 mice were analyzed for human immune cell subset reconstitution by flow cytometry. Frequencies of human CD3+ T cells (A), CD19+ B cells (B), and CD33+ myeloid cells (C) in spleen, liver, and bone marrow of HIS (◇) and HIS-SGM3 (♦) mice are shown. (D) Total cell counts of indicated human immune cell subsets in the liver, spleen, and bone marrow. (E) Representative fluorescence-activated cell sorter dot plots for bone marrow and spleen. Unpaired Student t test: *P ≤ .05; **P ≤ .005; ***P ≤ .0001. BM indicates bone marrow; error bars indicate SEM.
Figure 3
Figure 3
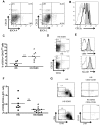
HIS-SGM3 mice show increased levels of myeloid DCs and decreased levels of primary HSCs in the bone marrow. Bone marrow–derived leukocytes from HIS and HIS-SGM3 mice were stained for the expression of human CD45, CD123, CD11c, CD1c (BDCA-1), BDCA-4, HLA-DR, and CD86 to analyze the development of human DCs. (A) Representative fluorescence-activated cell sorter plots demonstrate the presence of CD123+ plasmacytoid DCs and BDCA-3+ or BDCA-1+ myeloid DCs in HIS mice. (B) Histogram shows CD11c expression on CD123+ (light gray outline), BDCA-4+ (black outline), and BDCA-1+ (shaded area) DCs. (C) Frequencies of CD1c+ (BDCA-1+) myeloid DCs. (D) Original fluorescence-activated cell sorter dot plots. (E) Histograms show CD86 and HLA-DR expression on CD1c+ myeloid DCs in HIS mice (shaded area) and HIS-SGM3 mice (black outline) compared with isotype control (light black outline). To compare the maintenance of primary human HSCs in the bone marrow of HIS and HIS-SGM3 mice, human leukocytes were analyzed for the expression of CD34, CD38, c-KIT, and CD133. (F) Group data of human CD34+CD38-c-KIT+ HSC frequencies. Unpaired Student t test: **P ≤ .005
Figure 4
Figure 4
Elevated levels of CD4+ T cells in HIS-SGM3 mice. Twelve weeks after human CD34+ HSC engraftment, HIS and HIS-SGM3 mice were analyzed for human CD4+ to CD8+ T-cell ratios in blood (A), bone marrow (BM) (B), spleen (C), and liver (D). (E) Original fluorescence-activated cell sorter plots. Cells were gated on human CD45+CD3+ T cells. Unpaired Student t test: *P ≤ .05; **P ≤ .005; ***P ≤ .0001.
Figure 5
Figure 5
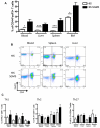
CD4+FoxP3+ regulatory T cells are selectively expanded in HIS-SGM3 mice. To determine the proportion of Treg cells within the CD3+CD4+ T-cell population, human leukocytes from 6 HIS and 6 HIS-SGM3 mice were analyzed for expression of transcription factor FoxP3 by flow cytometry. Frequencies of human CD4+FoxP3+ T cells in blood, spleen, liver, and bone marrow (BM) of HIS and HIS-SGM3 mice are shown in (A), with representative fluorescence-activated cell sorter plots from blood, spleen, and liver shown in (B). To determine the frequency of T-helper subsets Th1, Th2, and Th17 within the CD4+ T-cell population, cells were stimulated ex vivo with phorbol-12-myristate-13-acetate/ionomycin for 5 hours at 37°C and subsequently stained for intracellular IFN-γ (Th1), IL-4 (Th2), and IL-17 (Th17). (C) Group data of a total of 6 HIS and 6 HIS-SGM3 mice. Unpaired Student t test: *P ≤ .05; **P ≤ .005; ***P ≤ .0001. Error bars indicate SEM.
Figure 6
Figure 6
Thymocyte development in HIS and HIS-SGM3 mice. Human thymocyte development was analyzed 4, 8, and 12 weeks after human HSC transplantation by staining thymus-derived cells for the expression of human CD45, CD3, CD4, CD8, and FoxP3. (A) Total numbers of human CD45+CD3+ thymocytes at weeks 4, 8, and 12 in HIS and HIS-SGM3 mice are shown. (B) Frequencies of human CD4CD8 double-negative (DN), CD4+CD8+ double-positive (DP), CD4+ single-positive (CD4 SP), and CD8+ single-positive (CD8 SP) cells within the CD3+ thymocyte population at weeks 4, 8, and 12 are displayed. (C) The frequencies of single-positive CD3+CD4+FoxP3+ thymocytes at indicated time points in HIS and HIS-SGM3 mice are shown. (D) Original fluorescence-activated cell sorter plots showing FoxP3 expression in human CD4 SP thymocytes 12 weeks after HSC transplantation are depicted. Error bars indicate SEM.
Figure 7
Figure 7
Phenotypic and functional characteristics of CD4+FoxP3+ Treg cells expanded in HIS-SGM3 mice. Leukocytes isolated from blood, liver, and spleen of HIS and HIS-SGM3 mice were analyzed for the expression of human CD45, CD3, CD4, FoxP3, CD25, CD45RA, CD45RO, and CTLA-4 to determine the phenotype of in vivo expanded human Treg cells. (A) Representative histograms show CD45RO, CD25, and CTLA-4 expression on CD4+FoxP3 (shaded area) and CD4+FoxP3+ (black outline) T cells from the blood of HIS and HIS SGM3 mice compared with isotype control (light black outline). To test their suppressive capacity, CD4+FoxP3+ Treg cells from HIS-SGM3 mice were purified according to their CD25 expression (B) and cocultured with carboxyfluorescein succinimidyl ester (CFSE)–labeled autologous CD3+ T cells in the presence of anti-CD3/CD28. After 4 days of culture, the proliferation of human CD3+ T cells alone (C), in the presence of isolated CD4+CD25 T cells (D) (ratio 1:1), or in the presence of CD4+CD25+ Treg cells (E, ratio 1:1; F, ratio 2:1) was determined by flow cytometry. One of 4 individual experiments is shown.

References

    1. Shultz LD, Ishikawa F, Greiner DL. Humanized mice in translational biomedical research. Nat Rev Immunol. 2007;7(2):118–130. - PubMed
    1. Traggiai E, Chicha L, Mazzucchelli L, et al. Development of a human adaptive immune system in cord blood cell-transplanted mice. Science. 2004;304(5667):104–107. - PubMed
    1. Ishikawa F, Yasukawa M, Lyons B, et al. Development of functional human blood and immune systems in NOD/SCID/IL2 receptor gamma chainnull mice. Blood. 2005;106(5):1565–1573. - PMC - PubMed
    1. Shultz LD, Lyons BL, Burzenski LM, et al. Human lymphoid and myeloid cell development in NOD/LtSz-scid IL2R gamma null mice engrafted with mobilized human hemopoietic stem cells. J Immunol. 2005;174(10):6477–6489. - PubMed
    1. Brehm MA, Cuthbert A, Yang C, et al. Parameters for establishing humanized mouse models to study human immunity: analysis of human hematopoietic stem cell engraftment in 3 immunodeficient strains of mice bearing the IL2rgamma(null) mutation. Clin Immunol. 2010;135(1):84–98. - PMC - PubMed

Publication types

MeSH terms

Substances