. 2011 Feb;134(Pt 2):432-48.
doi: 10.1093/brain/awq348. Epub 2011 Jan 20.

Predicting functional decline in behavioural variant frontotemporal dementia

Affiliations

Predicting functional decline in behavioural variant frontotemporal dementia

Keith A Josephs Jr et al. Brain. 2011 Feb.

Abstract

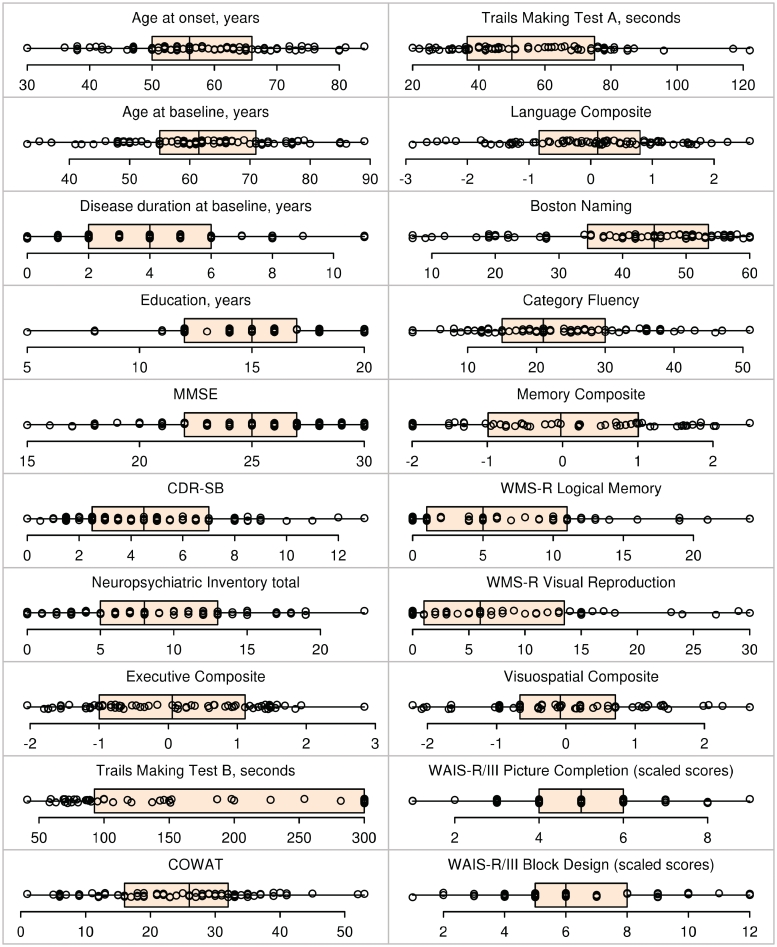
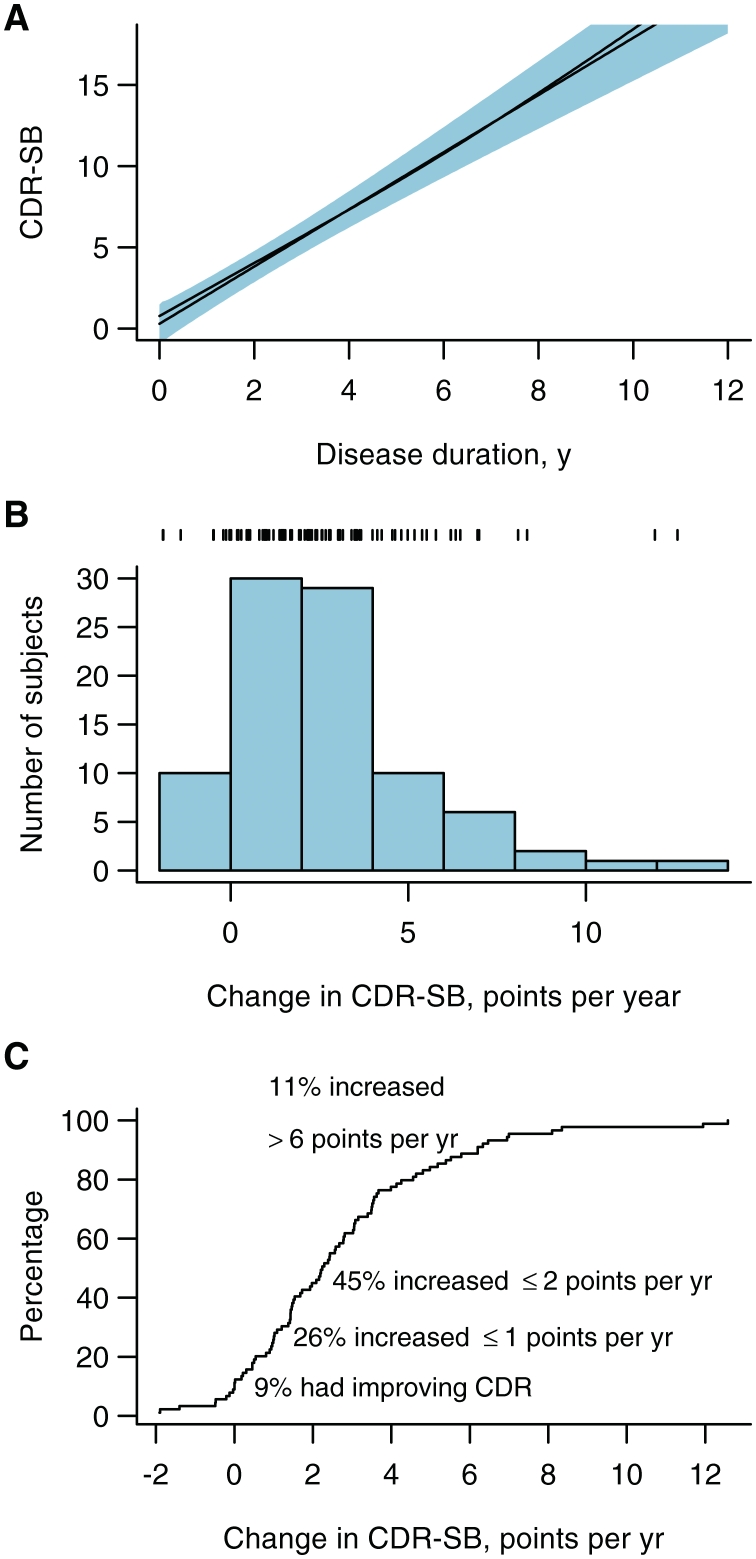
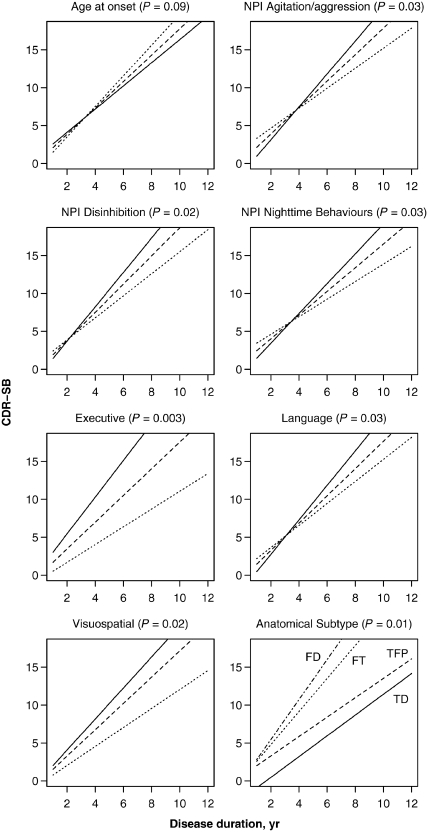
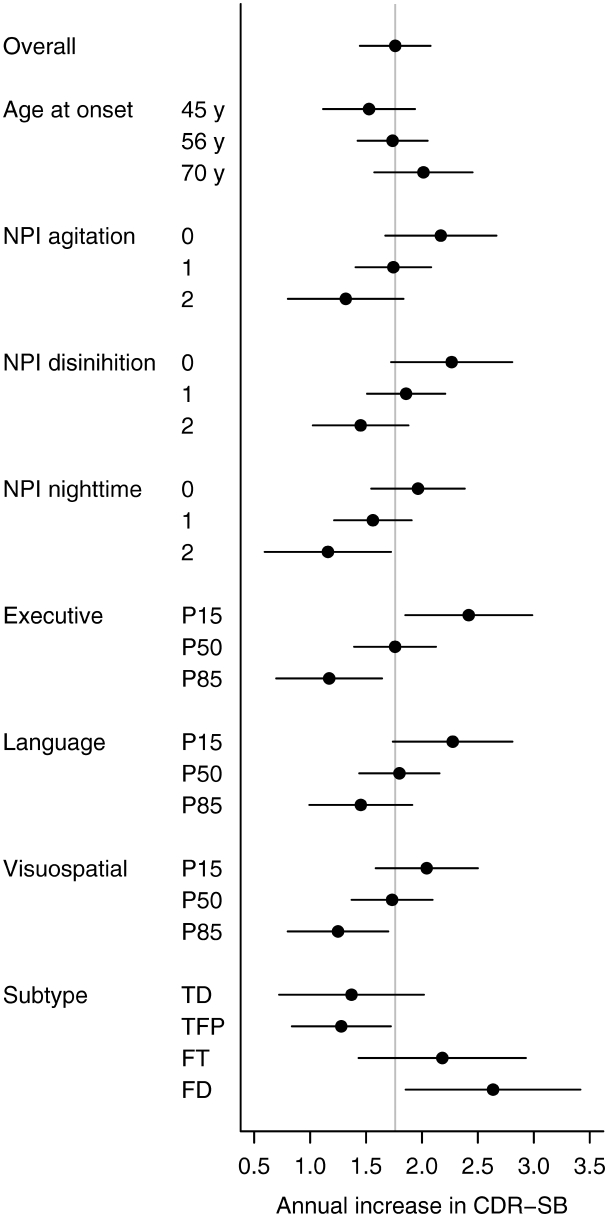
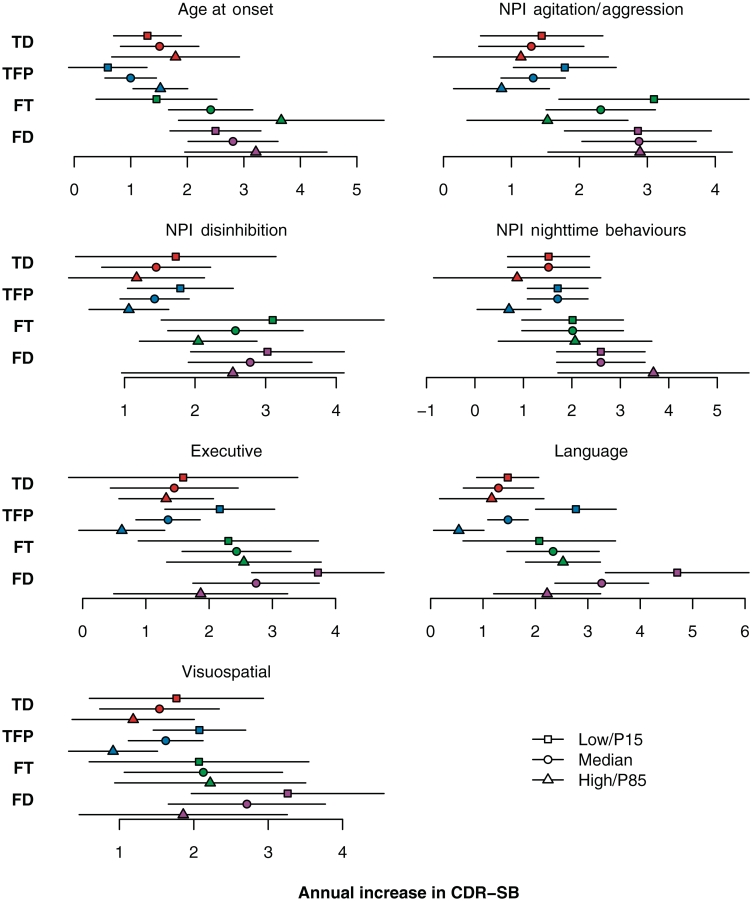
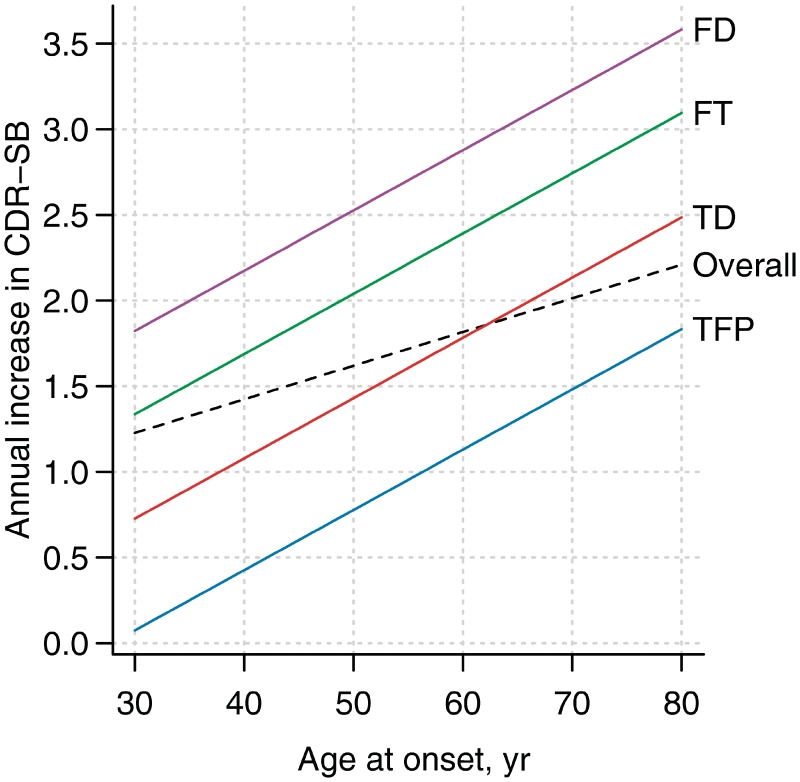
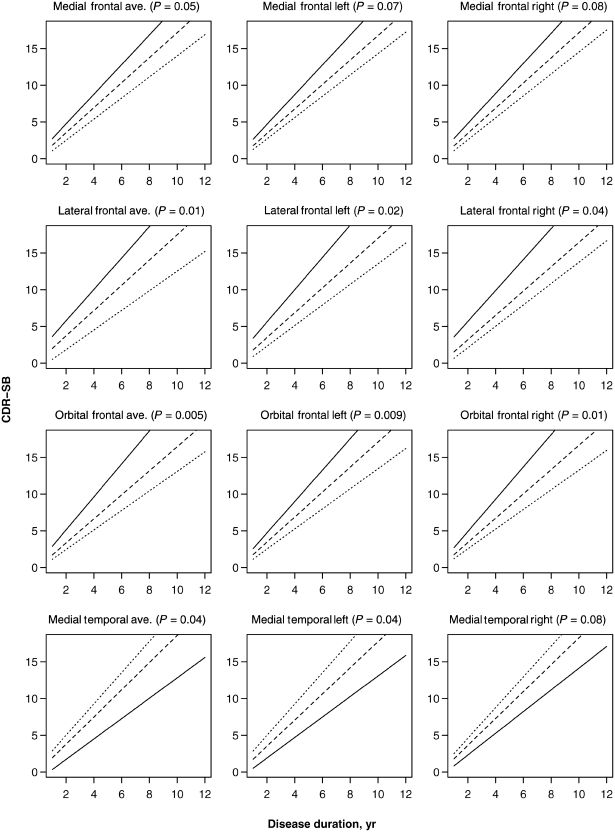
Behavioural variant frontotemporal dementia is characterized by a change in comportment. It is associated with considerable functional decline over the course of the illness albeit with sometimes dramatic variability among patients. It is unknown whether any baseline features, or combination of features, could predict rate of functional decline in behavioural variant frontotemporal dementia. The aim of this study was to investigate the effects of different baseline clinical, neuropsychological, neuropsychiatric, genetic and anatomic predictors on the rate of functional decline as measured by the Clinical Dementia Rating Sum of Boxes scale. We identified 86 subjects with behavioural variant frontotemporal dementia that had multiple serial Clinical Dementia Rating Sum of Boxes assessments (mean 4, range 2-18). Atlas-based parcellation was used to generate volumes for specific regions of interest at baseline. Volumes were utilized to classify subjects into different anatomical subtypes using the advanced statistical technique of cluster analysis and were assessed as predictor variables. Composite scores were generated for the neuropsychological domains of executive, language, memory and visuospatial function. Behaviours from the brief questionnaire form of the Neuropsychiatric Inventory were assessed. Linear mixed-effects regression modelling was used to determine which baseline features predict rate of future functional decline. Rates of functional decline differed across the anatomical subtypes of behavioural variant frontotemporal dementia, with faster rates observed in the frontal dominant and frontotemporal subtypes. In addition, subjects with poorer performance on neuropsychological tests of executive, language and visuospatial function, less disinhibition, agitation/aggression and night-time behaviours at presentation, and smaller medial, lateral and orbital frontal lobe volumes showed faster rates of decline. In many instances, the effect of the predictor variables observed across all subjects was also preserved within anatomical subtypes. Furthermore, some of the predictor variables improved our prediction of rate of functional decline after anatomical subtype was taken into account. In particular, age at onset was a highly significant predictor but only after adjusting for subtype. We also found that although some predictor variables, for example gender, Mini-Mental State Examination score, and apathy/indifference, did not affect the rate of functional decline; these variables were associated with the actual Clinical Dementia Rating Sum of Boxes score estimated for any given time-point. These findings suggest that in behavioural variant frontotemporal dementia, rate of functional decline is driven by the combination of anatomical pattern of atrophy, age at onset, and neuropsychiatric characteristics of the subject at baseline.


Figures

Figure 1
Figure 1
Box-plots with superimposed data points showing baseline demographic, cognitive and neuropsychological test results for all 86 subjects. Boxes indicate the median and quartiles and have whiskers extending to the furthest data point within 1.5 interquartile ranges of the box. Individual data points have been randomly perturbed in the vertical direction to reduce overlap. COWAT = Controlled Oral Word Association Test; WAIS-R/lll = Wechsler Adult Intelligence Scale-Revised/version three; WMS-R = Wechsler Memory Scale-Revised.
Figure 2
Figure 2
The distribution of annual rate of CDR-SB change across all 86 subjects in the study based on fitting a separate regression line for each subject. (A) Mean CDR-SB as a function of disease duration. The black line represents a point estimate for the mean while the blue shaded region represents pointwise 95% CIs. The black curve that almost coincides with the line represents the estimated mean based on a restricted cubic spline fit with knots at 2, 6 and 11 years and did not differ significantly from the straight-line fit (P = 0.35). (B) Histogram of the distribution of annual change in CDR-SB by subject based on calculating a slope estimate for each subject. Tick marks at the top of the plot indicate individual subject values. (C) The empirical cumulative distribution plot of the data shown in B. For a given value on the x-axis, the y-axis shows the percentage of subjects with an annual change less than that amount.
Figure 3
Figure 3
The effect of significant predictor variables on the rate of CDR-SB increase. Except for the anatomical subtype predictor, the solid line represents the estimated slope for a subject having a low value (defined as the 15th percentile), the dashed line represents the estimated slope for a subject having an average value (defined as the median), while the dotted line represents the estimated slope for a subject having a high value (defined as the 85th percentile). For age at onset, 15th percentile equates to age 45, median equates to age 56 and 85th percentile equates to age 70. For anatomical subtype, the solid line represents the estimated slope for the temporal dominant (TD) group, the dashed line represents the slope for the temporofrontoparietal (TFP) subtype, the dotted line represents the slope for the frontotemporal (FT) subtype, and the dotted–dashed line represents the slope for the frontal dominant (FD) subtype. The neuropsychological composite scores are adjusted for age at baseline and education and worse performance corresponds to a lower score and steeper slope. The significance of each predictor based on a test of the significance of the interaction term between duration and the predictor is shown in parentheses in each panel title. NPI = Neuropsychiatric Inventory.
Figure 4
Figure 4
The estimated annual CDR-SB increase and 95% confidence intervals by predictor compared with each other. We define ‘low’ to be the 15th percentile and ‘high’ to be the 85th percentile. The executive, language and visuospatial composite scores are adjusted for age at baseline and education and worse performance corresponds to a lower score and greater annual increase. The grey vertical line represents the overall estimated annual increase of 1.8 points per year. FD = frontal dominant subtype; FT = frontotemporal subtype; NPI = Neuropsychiatric Inventory; TD = temporal dominant subtype; TFP = temporofrontoparietal subtype.
Figure 5
Figure 5
The estimated annual CDR-SB increase and 95% confidence intervals by predictor stratified by anatomical subtype. We define ‘low’ to be the 15th percentile (P15) and ‘high’ to be the 85th percentile (P85). The executive, language and visuospatial composite scores are adjusted for age at baseline and education and worse performance corresponds to a lower score and greater annual increase as can be seen in the temporofrontoparietal (TFP) and frontal dominant (FD) subtype; a less dramatic trend was observed for the temporal dominant subtype (TD). FT = frontotemporal subtype; NPI = Neuropsychiatric Inventory.
Figure 6
Figure 6
Estimated annual increase in CDR-SB as a function of age of onset. This figure complements the top-left panel of Fig. 5 and can be used as a graphical ‘look-up table’ to estimate rates of CDR increase for a given age at onset overall and by anatomical subtype. The overall estimates are based on a slope model with age of onset as the predictor. The subtype-specific estimates are based on adding subtype-specific slopes to this model. FD = frontal dominant subtype; FT = frontotemporal subtype; TD = temporal dominant subtype; TFP = temporofrontoparietal subtype.
Figure 7
Figure 7
The effect of significant regions of interest predictor variables on the rate of CDR-SB increase. The solid line represents the estimated slope for a subject having a low value (defined as the 15th percentile), the dashed line represents the estimated slope for a subject having an average value (defined as the median), while the dotted line represents the estimated slope for a subject having a high value (defined as the 85th percentile). The significance of each predictor based on a test of the significance of the interaction term between duration and the predictor is shown in parentheses in each panel title.

References

    1. Ashburner J, Friston KJ. Unified segmentation. Neuroimage. 2005;26:839–51. - PubMed
    1. Benton AL, Hamsher K. Manual. Iowa City: University of Iowa; 1989. Multilingual Aphasia Examination.
    1. Brambati SM, Renda NC, Rankin KP, Rosen HJ, Seeley WW, Ashburner J, et al. A tensor based morphometry study of longitudinal gray matter contraction in FTD. Neuroimage. 2007;35:998–1003. - PMC - PubMed
    1. Burke WJ, Miller JP, Rubin EH, Morris JC, Coben LA, Duchek J, et al. Reliability of the Washington University Clinical Dementia Rating. Arch Neurol. 1988;45:31–2. - PubMed
    1. Chiu WZ, Kaat LD, Seelaar H, Rosso SM, Boon AJ, Kamphorst W, et al. Survival in progressive supranuclear palsy and frontotemporal dementia. J Neurol Neurosurg Psychiatry. 2010;81:441–5. - PubMed

Publication types

MeSH terms