. 2011 Jun;18(6):1057-70.
doi: 10.1038/cdd.2010.181. Epub 2011 Jan 21.

Autocrine motility factor/phosphoglucose isomerase regulates ER stress and cell death through control of ER calcium release

Affiliations

Autocrine motility factor/phosphoglucose isomerase regulates ER stress and cell death through control of ER calcium release

M Fu et al. Cell Death Differ. 2011 Jun.

Abstract

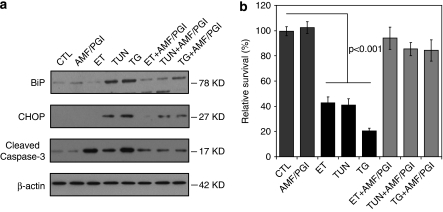
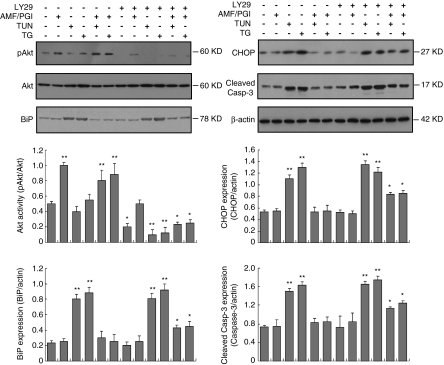
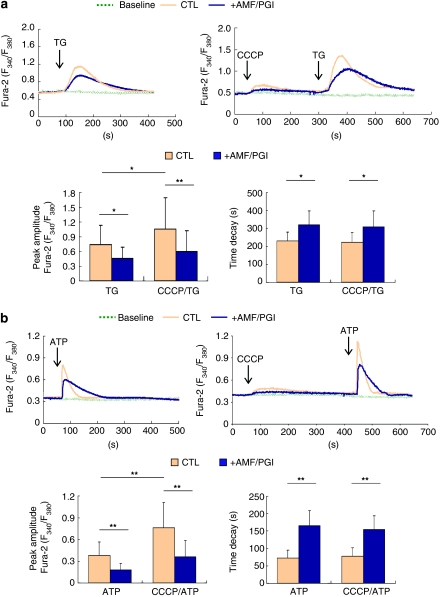
Autocrine motility factor/ phosphoglucose isomerase (AMF/PGI) promotes cell survival by the pAkt survival pathway. Its receptor, gp78/AMFR, is an E3 ubiquitin ligase implicated in endoplasmic reticulum (ER)-associated protein degradation. We demonstrate here that AMF/PGI also protects against thapsigargin (TG)- and tunicamycin (TUN)-induced ER stress and apoptosis. AMF/PGI protection against the ER stress response is receptor mediated as it is not observed in gp78/AMFR-knockdown HEK293 cells. However, AMF/PGI protection against the ER stress response by TG and TUN was mediated only partially through PI3K/Akt activation. AMF/PGI reduction of the elevation of cytosolic calcium in response to either TG or inositol 1,4,5-trisphosphate receptor activation with ATP was gp78/AMFR-dependent, independent of mitochondrial depolarization and not associated with changes in ER calcium content. These results implicate regulation of ER calcium release in AMF/PGI protection against ER stress and apoptosis. Indeed, sequestration of cytosolic calcium with BAPTA-AM limited the ER stress response. Importantly, elevation of cytosolic calcium upon treatment with the calcium ionophore ionomycin, while not inducing an ER stress response, did prevent AMF/PGI protection against ER stress. By regulating ER calcium release, AMF/PGI interaction with gp78/AMFR therefore protects against ER stress identifying novel roles for these cancer-associated proteins in promoting tumor cell survival.


Figures

Figure 1
Figure 1
AMF/PGI prevents TUN and TG-induced ER stress response and cell death. (a) Cos7 cells, either untreated (CTL) or pretreated, with 24 μg/ml AMF/PGI (+AMF/PGI) for 8 h before addition of 2 μg/ml tunicamycin (TUN) or 3 μM thapsigargin (TG) for 8 h were fixed and immunofluorescently labeled with antibodies to the ER protein calnexin. Scale bar, 30 μm; in box: 6 μm. (b) Cos7 cells treated as in a were immunoblotted with antibodies to BiP, CHOP and β-actin. (c) Cos7 cells treated as in a were double labeled by Annexin V and PI and detected by flow cytometry. Bar graph shows percentage of Annexin V and PI-positive cells (Mean±S.E.M.; *P<0.05, **P<0.01 relative to CTL cells)
Figure 2
Figure 2
AMF/PGI prevents TUN and TG-induced apoptosis-associated events. (a) Cos7 cells were sub-fractionated into cytosol, nuclei, ER/plasma membrane, as well as mitochondrial fractions. Antibodies to α-tubulin, α-fibrilarin and calnexin, as well as cytochrome c as markers, respectively. Cytosolic fractions of Cos7 cells, either untreated (CTL) or pretreated, with 24 μg/ml AMF/PGI (+AMF/PGI) for 8 h before addition of either 2 μg/ml TUN or 3 μM TG for 8 h were immunoblotted with cytochrome c, cleaved caspase-3 and anti-tubulin antibodies, and mitochondrial fractions immunoblotted with cytochrome c antibodies. (b) Cos7 cells treated as in a were immunofluorescently labeled with antibodies to cytochrome c (red) and mitochondrial OxphosV (green) and nuclei stained with Hoechst33257 (blue). Scale bar, 40 μm; in box: 10 μm. Bar graph shows percentage of cytochrome c labeling that overlaps with OxphosV-labeled mitochondria relative to total cytochrome c labeling per cell (Mean±S.E.M.; *P<0.05, **P<0.01 relative to CTL cells)
Figure 3
Figure 3
AMF/PGI prevents etoposide, TUN and TG-induced cell death. (a) Cos7 cells were either untreated (CTL) or pretreated with 24 μg/ml AMF/PGI for 8 h before addition of either 100 μM etoposide (ET), 2 μg/ml TUN or 3 μM TG. Cell lysates were immunoblotted with antibodies to BiP, CHOP, cleaved caspase-3 as well as β-actin. (b) Bar graphs show the percentage of survival after 48 h of cells treated as in (a) by crystal violet assay (Mean±S.E.M.; *P<0.05, **P<0.01 relative to CTL cells)
Figure 4
Figure 4
AMF/PGI does not protect against the ER stress response and apoptosis in gp78/AMFR knockdown cells. (a) Stable gp78/AMFR microRNA (miR2 and miR3) and non-targeted control (NTC1 and NTC2)-transfected HEK293 cells were immunoblotted with 3F3A anti-gp78/AMFR and β-actin antibodies. Reduced gp78/AMFR expression was quantified relative to β-actin by densitometry. (b) miR2, miR3, NTC1 and NTC2 cells were surface labeled with the 3F3A anti-gp78/AMFR antibody and Alexa-647 anti-rat IgM secondary antibody at 4°C and detected by flow cytometry. Bar graph shows percentage of the 3F3A anti-gp78/AMFR-positive cells. (c) Gp78/AMFR microRNA (miR2 and miR3) or non-targeted control (NTC1 and NTC2) transfected HEK293 cells either untreated (CTL) or pretreated with 24 μg/ml AMF/PGI (+AMF/PGI) for 8 h before addition of 2 μg/ml TUN or 3 μM TG for 8 h were immunoblotted with antibodies to CHOP and cleaved caspase-3. Graphs show quantification of CHOP (top) and cleaved caspase-3 (bottom) relative to β-actin bands by densitometry (n=3, ±S.E.M.; *P<0.05; **P<0.01 relative to NTC1 cells)
Figure 5
Figure 5
PI3K inhibition with LY294002 only partially reversed AMF/PGI protection against ER stress and apoptosis. Cos7 cells either untreated or pretreated with 50 μM LY294002 (LY29), or pretreated with 50 μM LY294002 (LY29) plus 24 μg/ml AMF/PGI (+AMF/PGI) for 8 h before addition of either 2 μg/ml TUN or 3 μM TG for 8 h were immunoblotted with antibodies to pAkt, Akt, BiP, CHOP, cleaved caspase-3 antibodies, as indicated. Graphs show quantification of Akt activity (pAkt/Akt) as well as BiP, CHOP and cleaved caspase-3 expression relative to β-actin by densitometry (n=3, ±S.E.M.; *P<0.05; **P<0.01 relative to CTL cells)
Figure 6
Figure 6
AMF/PGI suppresses induction of [Ca2+]cyt and [Ca2+]m by TUN and TG. (a) Representative recordings of TUN or TG-evoked cytosolic Ca2+ transients recorded by Fura-2 ratio (F340/F380) in Cos7 cells with (dark blue) or without (light beige) AMF/PGI pretreatment (24 μg/ml; 8 h), as indicated. Bar graphs show [Ca2+]cyt peak amplitude and area under curve, as well as time decay of Ca2+ transients response to TUN or TG stimulation. (b) Confocal microscope images of Rhod-2 loaded Cos7 cells counterstained with MitoTracker Green. Scale bar, 30 μm. (c) Representative recordings of TUN or TG-evoked [Ca2+]m elevation recorded by Rhod-2 fluorescence (F/F0) in Cos7 cells with (dark blue) or without (light beige) AMF/PGI pretreatment (24 μg/ml; 8 h), as indicated. Bar graphs show [Ca2+]m peak amplitude and area under curve in response to TUN or TG stimulation (mean±S.E.M.; 60–90 responding cells; *P<0.05, **P<0.01 relative to CTL cells). The color reproduction of this figure is available on the html full text version of the manuscript
Figure 7
Figure 7
AMF/PGI regulation of TG and ATP-evoked [Ca2+]cyt is dependent on gp78/AMFR expression. (a) Representative recordings of TG-evoked cytosolic Ca2+ transients recorded by Fura-2 ratio (F340/F380) in NTC1, NTC2, miR2 and miR3 cells with (dark blue) or without (light beige) AMF/PGI pretreatment (24 μg/ml; 8 h), as indicated. Bar graphs show [Ca2+]cyt peak amplitude and area under curve as well as time decay of Ca2+ transients in response to TG stimulation in NTC1, NTC2, miR2 and miR3 cells with (dark blue) or without (light beige) AMF/PGI treatment. (b) Representative recordings of ATP-evoked cytosolic Ca2+ transients recorded by Fura-2 ratio (F340/F380) in NTC1, NTC2, miR2 and miR3 cells with (dark blue) or without (light beige) AMF/PGI pretreatment (24 μg/ml; 8 h), as indicated. Bar graphs show cytosolic Ca2+ peak amplitude and area under curve response to ATP stimulation in NTC1, NTC2, miR2 and miR3 cells with (dark blue) or without (light beige) AMF/PGI treatment. (Mean±S.E.M.; 100–150 responding cells; *P<0.05, **P<0.01 relative to CTL cells). The color reproduction of this figure is available on the html full text version of the manuscript
Figure 8
Figure 8
AMF/PGI suppression of [Ca2+]cyt is independent of mitochondrial Ca2+ uptake. (a) Representative recordings of TG alone as well as sequential CCCP and TG-induced [Ca2+]cyt dynamics were recorded by Fura-2 ratio (F340/F380) in Cos7 cells with (dark blue) or without (light beige) AMF/PGI pretreatment (24 μg/ml; 8 h), as indicated. Bar graphs show cytosolic Ca2+ peak amplitude, and time decay of Ca2+ transient in response to TG alone or CCCP and TG stimulation with (dark blue) or without (light beige) AMF/PGI pretreatment. (b) Representative recordings of ATP alone as well as sequential CCCP and ATP induced cytosolic Ca2+ dynamics recorded by Fura-2 ratio (F340/F380) in Cos7 cells with (dark blue) or without (light beige) AMF/PGI pretreatment (24 μg/ml; 8 h), as indicated. Bar graphs show [Ca2+]cyt peak amplitude and time decay of Ca2+ transients in response to ATP alone or CCCP, and ATP stimulation with (dark blue) or without (light beige) AMF/PGI pretreatment (Mean±S.E.M.; *P<0.05, **P<0.01 relative to CTL cells). The color reproduction of this figure is available on the html full text version of the manuscript
Figure 9
Figure 9
AMF/PGI decreases Ca2+ release from the ER. (a) Confocal images of Cos7 cells transiently transfected with an ER-targeted Ca2+-sensitive fluorescent protein D1ER cameleon and KDEL monomeric red fluorescent protein (KDEL-mRFP). Scale bar, 30 μm. (b and c) Representative recordings of TG and ATP induced ER Ca2+ dynamics were recorded by the FRET-to-CFP emission ratio (FRET/CFP) in Cos7 cells with (dark blue) or without (light beige) AMF/PGI pretreatment (24 μg/ml; 8 h), as indicated. Bar graphs show the basal ER Ca2+, ER Ca2+ release, and time decay induced by both TG and ATP stimulation in Cos7 cells with (dark blue) or without (light beige) AMF/PGI treatment (Mean±S.E.M.; *P<0.05, **P<0.01 relative to CTL cells). The color reproduction of this figure is available on the html full text version of the manuscript
Figure 10
Figure 10
AMF/PGI prevention of TUN and TG-induced ER stress is Ca2+ dependent. Cos7 cells were either untreated (control) or pretreated with 24 μg/ml AMF/PGI for 8 h before addition of either 2 μg/ml TUN or 3 μM TG for 8 h in the presence 40 μM BAPTA-AM (Bapta; a) or 1 mM Ca2+ plus 1 μM ionomycin (+Ca Iono; b), as indicated. Treated cells were immunoblotted with antibodies to BiP, CHOP, cleaved caspase-3 as well as β-actin and bands quantified relative to β-actin by densitometry (Mean±S.E.M.; *P<0.05, **P<0.01 relative to control cells)

Similar articles

Cited by

References

    1. Ellgaard L, Helenius A. Quality control in the endoplasmic reticulum. Nat Rev Mol Cell Biol. 2003;4:181–191. - PubMed
    1. Papp S, Dziak E, Michalak M, Opas M. Is all of the endoplasmic reticulum created equal? The effects of the heterogeneous distribution of endoplasmic reticulum Ca2+-handling proteins. J Cell Biol. 2003;160:475–479. - PMC - PubMed
    1. Boyce M, Yuan J. Cellular response to endoplasmic reticulum stress: a matter of life or death. Cell Death Differ. 2006;13:363–373. - PubMed
    1. Bernales SN, Papa FR, Walter P. Intracellular signaling by the unfolded protein response. Annu Rev Cell Dev Biol. 2006;22:487–508. - PubMed
    1. Xu C, Bailly-Maitre B, Reed JC. Endoplasmic reticulum stress: cell life and death decisions. J Clin Invest. 2005;115:2656–2664. - PMC - PubMed

Publication types

MeSH terms