. 2010 Dec 17;5(12):e15465.
doi: 10.1371/journal.pone.0015465.

Regional management units for marine turtles: a novel framework for prioritizing conservation and research across multiple scales

Affiliations

Regional management units for marine turtles: a novel framework for prioritizing conservation and research across multiple scales

Bryan P Wallace et al. PLoS One. .

Abstract

Background: Resolving threats to widely distributed marine megafauna requires definition of the geographic distributions of both the threats as well as the population unit(s) of interest. In turn, because individual threats can operate on varying spatial scales, their impacts can affect different segments of a population of the same species. Therefore, integration of multiple tools and techniques--including site-based monitoring, genetic analyses, mark-recapture studies and telemetry--can facilitate robust definitions of population segments at multiple biological and spatial scales to address different management and research challenges.

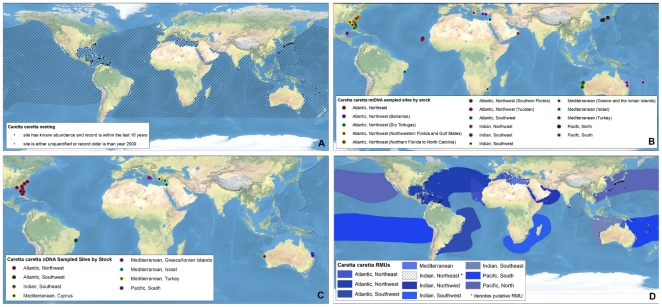
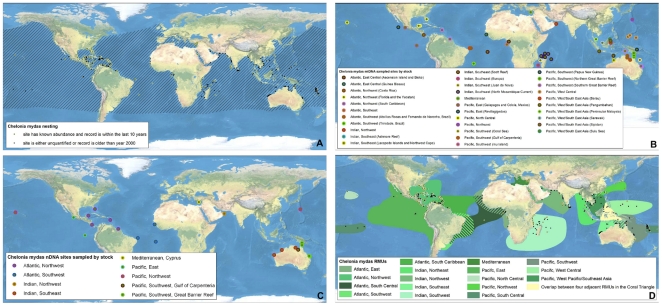
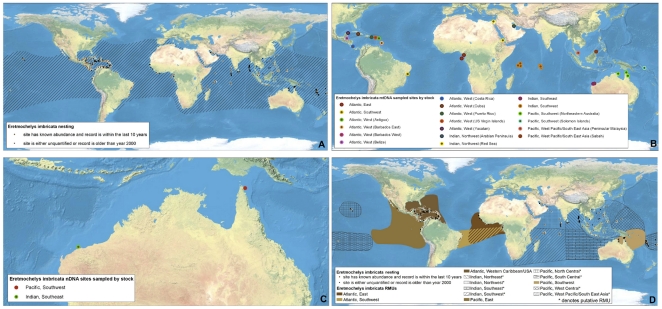
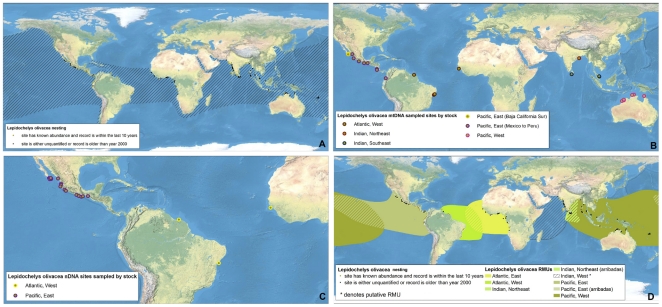
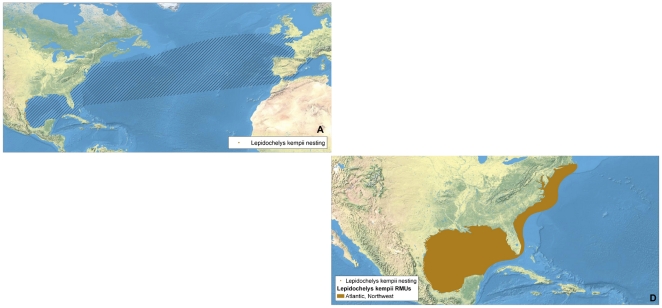
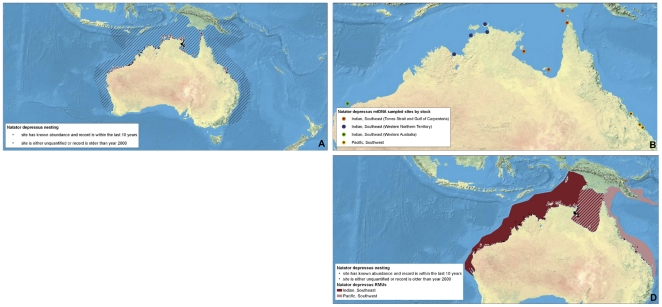
Methodology/principal findings: To address these issues for marine turtles, we collated all available studies on marine turtle biogeography, including nesting sites, population abundances and trends, population genetics, and satellite telemetry. We georeferenced this information to generate separate layers for nesting sites, genetic stocks, and core distributions of population segments of all marine turtle species. We then spatially integrated this information from fine- to coarse-spatial scales to develop nested envelope models, or Regional Management Units (RMUs), for marine turtles globally.

Conclusions/significance: The RMU framework is a solution to the challenge of how to organize marine turtles into units of protection above the level of nesting populations, but below the level of species, within regional entities that might be on independent evolutionary trajectories. Among many potential applications, RMUs provide a framework for identifying data gaps, assessing high diversity areas for multiple species and genetic stocks, and evaluating conservation status of marine turtles. Furthermore, RMUs allow for identification of geographic barriers to gene flow, and can provide valuable guidance to marine spatial planning initiatives that integrate spatial distributions of protected species and human activities. In addition, the RMU framework--including maps and supporting metadata--will be an iterative, user-driven tool made publicly available in an online application for comments, improvements, download and analysis.


Conflict of interest statement

Competing Interests: MYC is employed by a commercial company that provides ecological modelling services, and although he was involved in all aspects of this study, his affiliation did not interfere in any way with the objective development or execution of this study; MHG and BW are employed by U.S. state government agencies, and PHD and JAS are employed by a U.S. federal government agency; however these affiliations did not interfere with the objective development or execution of this study. All authors confirm that these competing interests do not alter their adherence to all PLoS ONE policies on sharing data and materials, i.e., to make freely available any materials and information described in their publication that are reasonably requested by others for the purpose of academic, non-commercial research.

Figures

Figure 1
Figure 1. Multi-scale Regional Management Units for loggerhead turtles Caretta caretta.
Individual maps are presented for A) global nesting sites and in-water distributions (global distributions for each species represented by hatching); B) mitochondrial (mtDNA) genetic stocks; C) nuclear genetic (nDNA) stocks; and D) Regional Management Units (shown with nesting sites). Nesting sites that were unquantified or have no count values reported since 2000 are represented by black squares, whereas nesting sites for which count data are available are represented by a colored circle. For genetic stock maps (Figs. 1B and C), each symbol represents a different site that was sampled for genetic analyses, while each color represents a distinct genetic stock. Putative RMUs (see text for description) are noted by asterisks in the figure legends, and are colorless. Data shown are contained in metadata tables (Appendix S2).
Figure 2
Figure 2. Multi-scale Regional Management Units for green turtles Chelonia mydas.
Individual maps are presented for A) global nesting sites and in-water distributions (global distributions for each species represented by hatching); B) mitochondrial (mtDNA) genetic stocks; C) nuclear genetic (nDNA) stocks; and D) Regional Management Units (shown with nesting sites). Nesting sites that were unquantified or have no count values reported since 2000 are represented by black squares, whereas nesting sites for which count data are available are represented by a colored circle. For genetic stock maps (Figs. 2B and C), each symbol represents a different site that was sampled for genetic analyses, while each color represents a distinct genetic stock. Data shown are contained in metadata tables (Appendix S2).
Figure 3
Figure 3. Multi-scale Regional Management Units for leatherback turtles Dermochelys coriacea.
Individual maps are presented for A) global nesting sites and in-water distributions (global distributions for each species represented by hatching); B) mitochondrial (mtDNA) genetic stocks; C) nuclear genetic (nDNA) stocks; and D) Regional Management Units (shown with nesting sites). Nesting sites that were unquantified or have no count values reported since 2000 are represented by black squares, whereas nesting sites for which count data are available are represented by a colored circle. For genetic stock maps (Figs. 3B and C), each symbol represents a different site that was sampled for genetic analyses, while each color represents a distinct genetic stock. Data shown are contained in metadata tables (Appendix S2).
Figure 4
Figure 4. Multi-scale Regional Management Units for hawksbill turtles Eretmochelys imbricata.
Individual maps are presented for A) global nesting sites and in-water distributions (global distributions for each species represented by hatching); B) mitochondrial (mtDNA) genetic stocks; C) nuclear genetic (nDNA) stocks; and D) Regional Management Units (shown with nesting sites). Nesting sites that were unquantified or have no count values reported since 2000 are represented by black squares, whereas nesting sites for which count data are available are represented by a colored circle. For genetic stock maps (Figs. 4B and C), each symbol represents a different site that was sampled for genetic analyses, while each color represents a distinct genetic stock. Putative RMUs (see text for description) are noted by asterisks in the figure legends, and are colorless. Data shown are contained in metadata tables (Appendix S2).
Figure 5
Figure 5. Multi-scale Regional Management Units for olive ridley turtles Lepidochelys olivacea.
Individual maps are presented for A) global nesting sites and in-water distributions (global distributions for each species represented by hatching); B) mitochondrial (mtDNA) genetic stocks; C) nuclear genetic (nDNA) stocks; and D) Regional Management Units (shown with nesting sites). Nesting sites that were unquantified or have no count values reported since 2000 are represented by black squares, whereas nesting sites for which count data are available are represented by a colored circle. For genetic stock maps (Figs. 5B and C), each symbol represents a different site that was sampled for genetic analyses, while each color represents a distinct genetic stock. Putative RMUs (see text for description) are noted by asterisks in the figure legends, and are colorless. Data shown are contained in metadata tables (Appendix S2).
Figure 6
Figure 6. Multi-scale Regional Management Units for Kemp's ridley turtles Lepidochelys kempii.
Individual maps are presented for A) global nesting sites and in-water distributions (global distributions for each species represented by hatching); and D) Regional Management Units (shown with nesting sites). Nesting sites that were unquantified or have no count values reported since 2000 are represented by black squares, whereas nesting sites for which count data are available are represented by a colored circle. Putative RMUs (see text for description) are noted by asterisks in the figure legends, and are colorless. Note: There are no genetics maps (Panels B or C) for L. kempii because all individuals are presumed to belong to same stock and RMU. Data shown are contained in metadata tables (Appendix S2).
Figure 7
Figure 7. Multi-scale Regional Management Units for flatback turtles Natator depressus.
Individual maps are presented for A) global nesting sites and in-water distributions (global distributions for each species represented by hatching); B) mitochondrial (mtDNA) genetic stocks; and D) Regional Management Units (shown with nesting sites). Nesting sites that were unquantified or have no count values reported since 2000 are represented by black squares, whereas nesting sites for which count data are available are represented by a colored circle. For genetic stock maps (Fig. 7B), each symbol represents a different site that was sampled for genetic analyses, while each color represents a distinct genetic stock. Note: There is no map for N. depressus nDNA stocks (panel C, due to lack of available data). Data shown are contained in metadata tables (Appendix S2).

References

    1. Foley MM, Halpern BS, Micheli F, Armsby MH, Caldwell MR, et al. Guiding ecological principles for marine spatial planning. Mar Pol. 2010;34:955–966.
    1. Bowen BW, Bass AL, Soares L, Toonen RJ. Conservation implications of complex population structure: lessons from the loggerhead turtle (Caretta caretta). Mol Ecol. 2005;14:2389–2402. - PubMed
    1. Suryan RM, Saba VS, Wallace BP, Hatch SA, Frederiksen M, et al. Environmental forcing on life history strategies: Multi-trophic level response at ocean basin scales. Prog Oceanogr. 2009;81:214–218.
    1. Taylor BL, Dizon AE. First policy then science: why a management unit based solely on genetic criteria cannot work. Mol Ecol. 1999;8:S11–S16. - PubMed
    1. Moritz C. Defining ‘evolutionary significant units’ for conservation. Trends in Ecology & Evolution. 1994;9:373–375. - PubMed

Publication types