

doi: 10.1007/s12410-010-9061-5.
Molecular MRI of Thrombosis
Affiliations
- PMID: 21253438
- PMCID: PMC3022329
- DOI: 10.1007/s12410-010-9061-5
Item in Clipboard
Molecular MRI of Thrombosis
Curr Cardiovasc Imaging Rep.
2010.
Abstract
This review focuses on recent approaches in using targeted MRI probes for noninvasive molecular imaging of thrombosis. Probe design strategies are discussed: choice of molecular target; nanoparticle versus small-molecule probe; and gadolinium versus iron oxide imaging reporter. Examples of these different design strategies are chosen from the recent literature. Novel contrast agents used to image direct and indirect binding to fibrin have been described as well as direct binding to activated platelets. Emphasis is placed on probes where utility has been demonstrated in animal models or in human clinical trials.
Figures
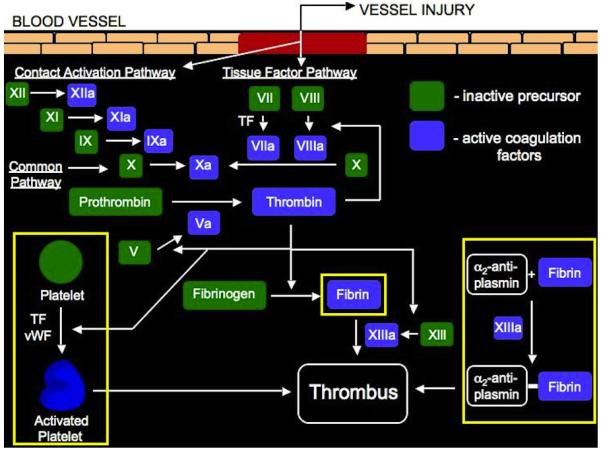
Schematic representation of the clotting cascade. Two pathways, contact activation (intrinsic) and tissue factor (extrinsic), which lead to thrombus formation are shown. Inactive precursors, represented in green, become activated coagulation factors, represented in blue, and catalyze the next reaction in the cascade, ultimately leading to cross-linked fibrin and thrombus formation. The targets for detecting thrombi discussed in this review are highlighted in yellow.
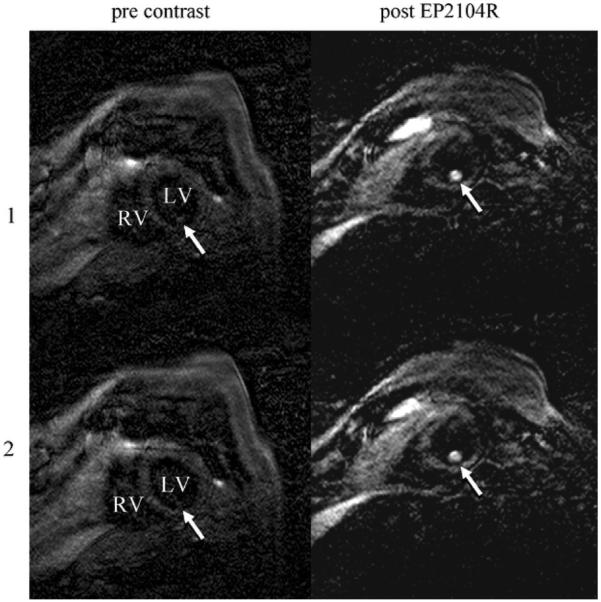
Molecular MRI of thrombus in the left ventricle of an 80-year-old man pre and post–EP-2104 injection. Two adjacent slices (1 and 2) from a three-dimensional dataset using an inversion recovery black-blood gradient-echo sequence are shown. The high local signal amplification allows for definitive localization of thrombus in the left ventricle (arrow). Note there is a slightly different view with respect to the main cardiac axis in the two MR sessions (pre-contrast and post–EP-2104R). LV—left ventricle; RV—right ventricle. (From Spuentrup et al. [35••]; with permission.)
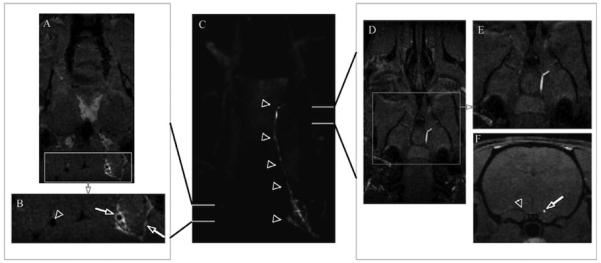
Occlusive aged thrombus and vessel wall enhancement (fresh thrombus) using EP–2104R-enhanced MRI in a rat embolic stroke model. Center panel (C) coronal maximum-intensity projection showing a region of enhancement extending the length of the right carotid artery to the MCA origin depicted by arrowheads. Left panel: (A) Source image and (B) enlargement of boxed area in (A) anterior to the carotid bifurcation showing vessel wall enhancement, likely mural thrombus (arrow), in the right internal carotid artery and enhanced clotted side branches (arrow) while contralateral carotid (arrowhead) shows no vessel wall enhancement. Right panel: (D) source image and (E) enlargement of boxed area in (D) at level of MCA origin revealing the presence of an occlusive thrombus; (F) axial reformat demonstrating occlusive thrombus (arrow) and patent contralateral artery (arrowhead). (From Uppal et al. [36•]; with permission.)
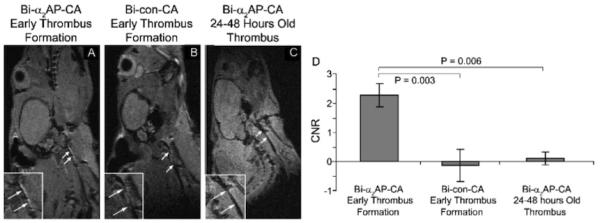
A–C, Molecular MRI of fresh (Panel A) and 24 to 48-hour-old thrombi (Panel C) in murine carotid arteries after injection of bimodal α2-antiplasmin–based contrast agent (Bi-α2AP-CA) or bimodal control contrast agent (Bi-con-CA, Panel B). The boxes at the lower left of the images are expansions around the carotid, and the arrows denote the location of the thrombus. Panel D shows the corresponding contrast-to-noise ratios (CNRs), which demonstrate a significant enhancement of the early thrombus with the targeted probe. (From Miserus et al. [41•]; with permission.)
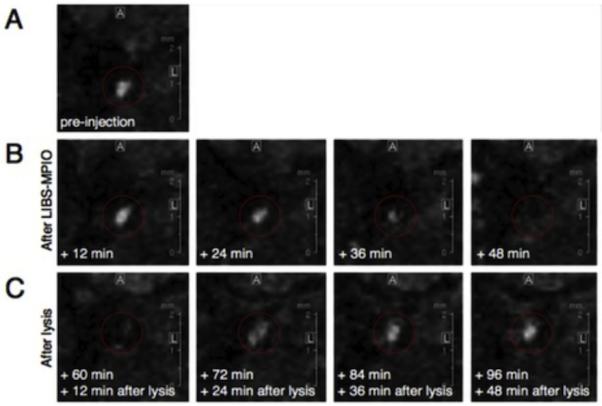
MRIs of an injured right carotid artery pre and post-injection of LIB MPIO in a mouse model of carotid thrombosis. Panel A shows the vessel pre-injection, which appears bright in this image. Panel B shows a time course after injection of the platelet-targeted iron oxide probe, which results in a signal decrease between 12 and 48 minutes. Panel C shows the effect of treatment with intravenous mouse urokinase beginning after the 48-minute scan and shows the reappearance of the vessel lumen signal over time. (From von zur Muhlen et al. [44••]; with permission.)
References
-
- White RH. The epidemiology of venous thromboembolism. Circulation. 2003;107:I4–I8. - PubMed
-
- Guercini F, Acciarresi M, Agnelli G, et al. Cryptogenic stroke: Time to determine aetiology. J Thromb Haemost. 2008;6:549–554. - PubMed
-
- Mazighi M, Labreuche J, Gongora-Rivera F, et al. Autopsy prevalence of intracranial atherosclerosis in patients with fatal stroke. Stroke. 2008;39:1142–1147. - PubMed
-
- Mazighi M, Labreuche J, Gongora-Rivera F, et al. Autopsy prevalence of proximal extracranial atherosclerosis in patients with fatal stroke. Stroke. 2009;40:713–718. - PubMed
Grants and funding
LinkOut - more resources
Full Text Sources
Other Literature Sources