. 2011 Jan 6;6(1):e15640.
doi: 10.1371/journal.pone.0015640.

Survey of tyrosine kinase signaling reveals ROS kinase fusions in human cholangiocarcinoma

Affiliations

Survey of tyrosine kinase signaling reveals ROS kinase fusions in human cholangiocarcinoma

Ting-Lei Gu et al. PLoS One. .

Abstract

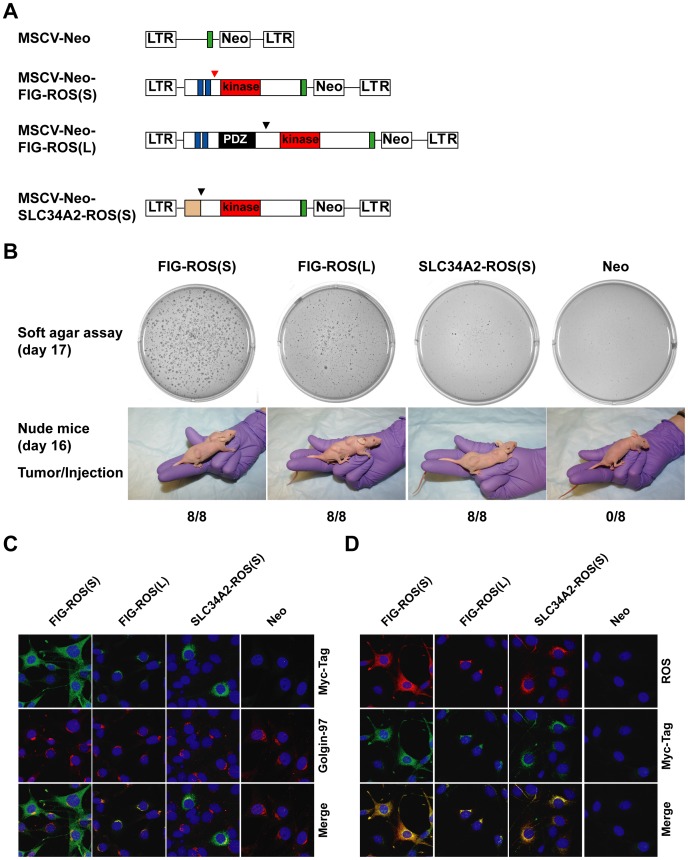
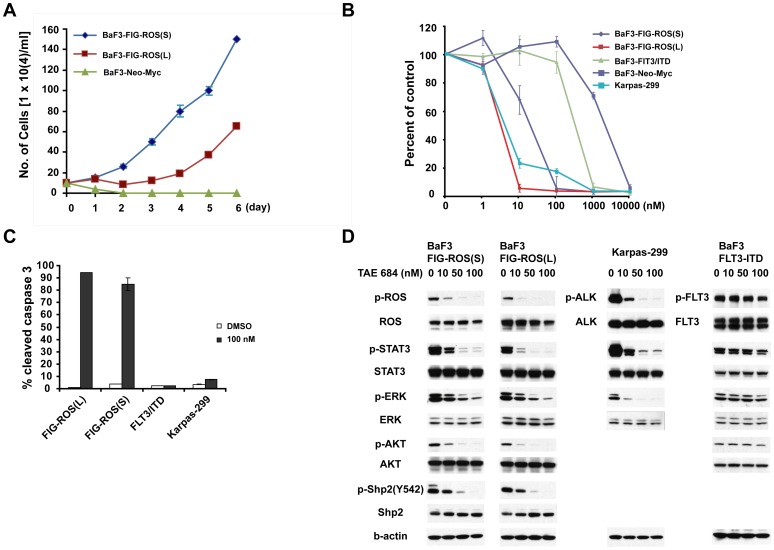
Cholangiocarcinoma, also known as bile duct cancer, is the second most common primary hepatic carcinoma with a median survival of less than 2 years. The molecular mechanisms underlying the development of this disease are not clear. To survey activated tyrosine kinases signaling in cholangiocarcinoma, we employed immunoaffinity profiling coupled to mass spectrometry and identified DDR1, EPHA2, EGFR, and ROS tyrosine kinases, along with over 1,000 tyrosine phosphorylation sites from about 750 different proteins in primary cholangiocarcinoma patients. Furthermore, we confirmed the presence of ROS kinase fusions in 8.7% (2 out of 23) of cholangiocarcinoma patients. Expression of the ROS fusions in 3T3 cells confers transforming ability both in vitro and in vivo, and is responsive to its kinase inhibitor. Our data demonstrate that ROS kinase is a promising candidate for a therapeutic target and for a diagnostic molecular marker in cholangiocarcinoma. The identification of ROS tyrosine kinase fusions in cholangiocarcinoma, along with the presence of other ROS kinase fusions in lung cancer and glioblastoma, suggests that a more broadly based screen for activated ROS kinase in cancer is warranted.


Conflict of interest statement

Competing Interests: The authors have read the journal's policy and have the following conflicts. T-LG, MT, KC, YW, VR, JN, JM, JR, CR, GI, BN, J. Yuan, J. Yu, HH, JR, and MJC are employees of Cell Signaling Technology. This does not alter the authors' adherence to all the PLoS ONE policies on sharing data and materials.

Figures

Figure 1
Figure 1. Identification of aberrantly phosphorylated tyrosine kinases in cholangiocarcinoma.
(A) and (B) Distribution of receptor tyrosine kinases (RTKs) and non-receptor tyrosine kinases (CTKs) in tumors and matching para-tumor tissues. The total number of spectral counts of each RTK/CTK is normalized against total number of phosphopeptides of GSK3A (100) in each sample, then the sum of the normalized number of each RTK/CTK as fractions of the total are shown. See Table S2. (C) Receptor tyrosine kinase (RTK) profiles from 23 CCA samples revealed heterogeneous tyrosine kinase activities in CCA. Average RTK signals from 20 normalized para-tumor tissues were subtracted from each CCA sample. The yellow color represents kinases aberrantly phosphorylated in CCA, and the blue color represents kinases under phosphorylated in tumor. ‘TC’ for cholangiocarcinoma tumor samples. (D) Ranking of RTK phosphorylation in CCA. Phospho level/sample was derived from average of normalized phosphopeptide spectra of each RTK from tumor samples showing positive signal of this RTK. (E) Distribution of RTKs in two cholangiocarcinoma samples (TC03 and TC23). RTK values were presented as fractions of the total RTK values from each sample.
Figure 2
Figure 2. Identification of ROS kinase fusions in CCA patients.
(A) Schematic diagram shows the Fused in Glioblastoma (FIG), ROS and FIG-ROS proteins. The position of the breakpoint is indicated by arrowhead (red or black). PDZ stands for PDZ domain, a protein-interaction domain; TM for transmembrane. Blue boxes refer to the two coiled-coil domains. The amino acid and DNA sequence from junction of the ROS fusions are listed. FIG-ROS (L) and FIG-ROS (S) refer to the long form and the short form of ROS fusions, respectively. (B) Expression of FIG and ROS mRNA in FIG-ROS positive cholangiocarcinoma patients. a. primer pairs FIG-F2 and ROS-GSP3.1 for FIG-ROS. b. primer pairs ROS-Ex31F and ROS-GSP2 for ROS. c. primer pairs FIG-F3 and FIG-R8 for FIG. U118MG and HCC78 were used as controls. (C) RT-PCR reaction identified a fusion of FIG to ROS in cDNA from two cholangiocarcinoma patients. GAPDH was used as a control. cDNA from U118MG cell line was included as a positive control. ‘C’ for cholangiocarcinoma, and ‘H’ for hepatocellular carcinoma. (D) Genomic breakpoints of FIG and ROS fusion gene for each patient. FIG intron sequences are shown in blue, and ROS intron sequences are shown in red or black. For TC23, the intron sequences between FIG-ROS fusion gene are composed of 1–822 base pair (bp) from intron 3 of FIG, antiparallel sequence of 620–656 bp derived from intron 35 of ROS (shown in red), and 666–1228 bp from intron 35 of ROS. For TC03, the intron sequences between FIG-ROS fusion gene consist of 1–2402 bp from intron 7 of FIG and 2317–2937 bp from intron 34 of ROS. Splice donor acceptor sites are shown in Italics.
Figure 3
Figure 3. Characterization of FIG-ROS fusions.
(A) Schematic representations of FIG-ROS used in the study. MSCV denotes murine stem cell virus; Neo for Neomycin; LTR for long terminal repeat; Green box for Myc-Tag. (B) Expression vectors for FIG-ROS(S), FIG-ROS(L), and SLC34A2-ROS(S) (or the corresponding empty vector) were introduced into 3T3 cells. Triplicate experiments were performed. The cells from representative experiment were photographed after 17 days of culture (upper panels). The same set of transfected cells was also injected subcutaneously at 2 sites into each nude mice, and tumor formation was examined after 16 days (lower panels). The number of tumors formed after eight injections are indicated. (C) and (D) ROS fusions display distinct subcellular localization. Shown is indirect immunofluorescence analysis of clonally derived 3T3 cells expressing FIG-ROS(S), FIG-ROS(L), SLC34A2-ROS(S) (or the corresponding empty vector). Cells were fixed and stained with Myc-Tag, Golgin-97(Golgi marker), and ROS antibody. Nuclei are stained with DAPI (blue).
Figure 4
Figure 4. Transformation, inhibition, and signaling properties of the FIG-ROS fusion tyrosine kinase.
(A) BaF3 cells retrovirally transduced with ROS fusion constructs were grown in the absence of IL-3. (B) Dose response graph of TAE684 for BaF3 cells expressing FIG-ROS fusions. BaF3/FLT3-ITD, and Karpas-299 (NPM-ALK) cells were used as controls. Triplicate experiments were performed. (C) Treatment with TAE684 increased apoptosis of BaF3 cells expressing FIG-ROS fusions, but not FLT3-ITD as measured by cleaved caspase-3 staining. Representative results from triplicate experiments were included. (D) Incubation with different concentrations of TAE684 resulted in decreased phosphorylation of ROS kinase, accompanied by decreased phosphorylation of STAT3, AKT, ERK, and Shp-2.

References

    1. Hertl M, Cosimi AB. Liver transplantation for malignancy. Oncologist. 2005;10:269–281. - PubMed
    1. Blechacz B, Gores GJ. Cholangiocarcinoma: advances in pathogenesis, diagnosis, and treatment. Hepatology. 2008;48:308–321. - PMC - PubMed
    1. de Groen PC, Gores GJ, LaRusso NF, Gunderson LL, Nagorney DM. Biliary tract cancers. N Engl J Med. 1999;341:1368–1378. - PubMed
    1. Farazi PA, DePinho RA. Hepatocellular carcinoma pathogenesis: from genes to environment. Nat Rev Cancer. 2006;6:674–687. - PubMed
    1. Manning G, Whyte DB, Martinez R, Hunter T, Sudarsanam S. The protein kinase complement of the human genome. Science. 2002;298:1912–1934. - PubMed