

Improved diagnostic accuracy of breast MRI through combined apparent diffusion coefficients and dynamic contrast-enhanced kinetics
- PMID: 21254208
- PMCID: PMC3201817
- DOI: 10.1002/mrm.22762
Improved diagnostic accuracy of breast MRI through combined apparent diffusion coefficients and dynamic contrast-enhanced kinetics
Abstract
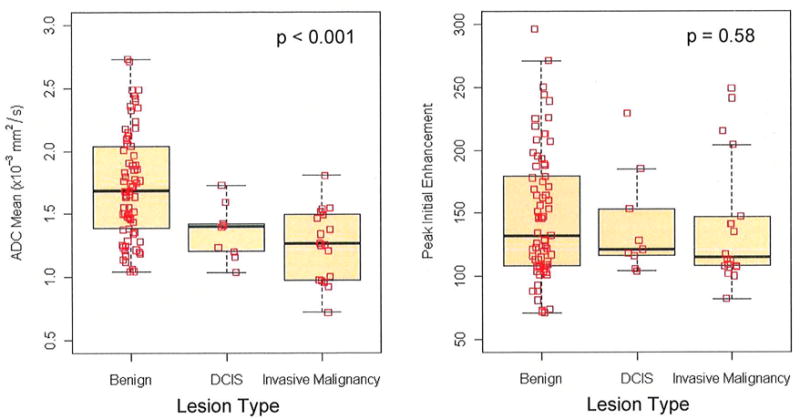
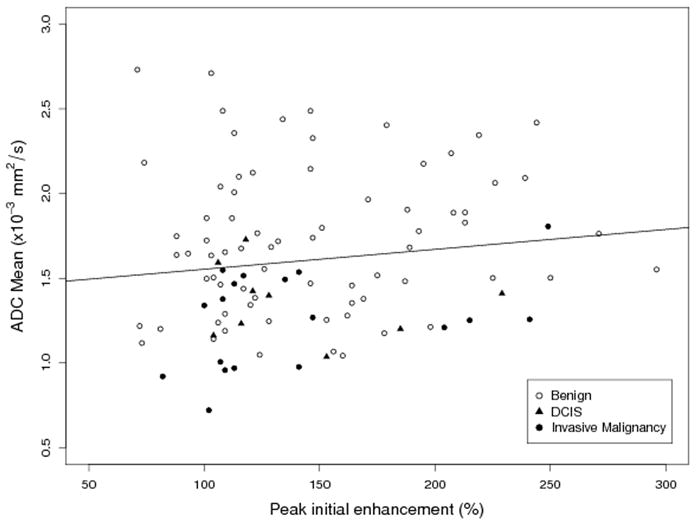
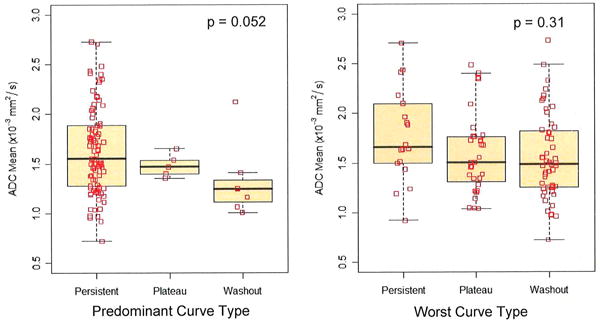
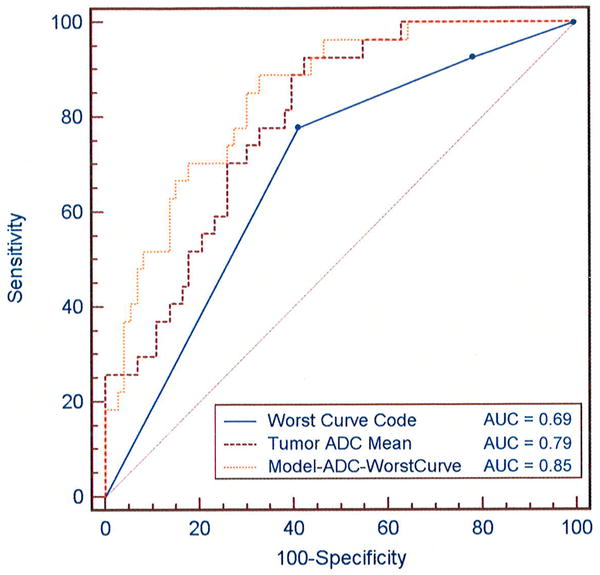
This study investigated the relationship between apparent diffusion coefficient (ADC) measures and dynamic contrast-enhanced magnetic resonance imaging (MRI) kinetics in breast lesions and evaluated the relative diagnostic value of each quantitative parameter. Seventy-seven women with 100 breast lesions (27 malignant and 73 benign) underwent both dynamic contrast-enhanced MRI and diffusion weighted MRI. Dynamic contrast-enhanced MRI kinetic parameters included peak initial enhancement, predominant delayed kinetic curve type (persistent, plateau, or washout), and worst delayed kinetic curve type (washout > plateau > persistent). Associations between ADC and dynamic contrast-enhanced MRI kinetic parameters and predictions of malignancy were evaluated. Results showed that ADC was significantly associated with predominant curve type (ADC was higher for lesions exhibiting predominantly persistent enhancement compared with those exhibiting predominantly washout or plateau, P = 0.006), but was not significantly associated with peak initial enhancement or worst curve type (P > 0.05). Univariate analysis showed significant differences between benign and malignant lesions in both ADC (P < 0.001) and worst curve (P = 0.003). In multivariate analysis, worst curve type and ADC were significant independent predictors of benign versus malignant outcome and in combination produced the highest area under the receiver operating characteristic curve (0.85 and 0.78 with 5-fold cross validation).
Copyright © 2011 Wiley-Liss, Inc.
Figures
References
-
- Saslow D, Boetes C, Burke W, Harms S, Leach MO, Lehman CD, Morris E, Pisano E, Schnall M, Sener S, Smith RA, Warner E, Yaffe M, Andrews KS, Russell CA. American Cancer Society guidelines for breast screening with MRI as an adjunct to mammography. CA Cancer J Clin. 2007;57(2):75–89. - PubMed
-
- Kriege M, Brekelmans CT, Boetes C, Besnard PE, Zonderland HM, Obdeijn IM, Manoliu RA, Kok T, Peterse H, Tilanus-Linthorst MM, Muller SH, Meijer S, Oosterwijk JC, Beex LV, Tollenaar RA, de Koning HJ, Rutgers EJ, Klijn JG. Efficacy of MRI and mammography for breast-cancer screening in women with a familial or genetic predisposition. N Engl J Med. 2004;351(5):427–437. - PubMed
-
- Schnall MD, Blume J, Bluemke DA, Deangelis GA, Debruhl N, Harms S, Heywang-Kobrunner SH, Hylton N, Kuhl CK, Pisano ED, Causer P, Schnitt SJ, Smazal SF, Stelling CB, Lehman C, Weatherall PT, Gatsonis CA. MRI detection of distinct incidental cancer in women with primary breast cancer studied in IBMC 6883. J Surg Oncol. 2005;92(1):32–38. - PubMed
-
- Lehman CD, Gatsonis C, Kuhl CK, Hendrick RE, Pisano ED, Hanna L, Peacock S, Smazal SF, Maki DD, Julian TB, DePeri ER, Bluemke DA, Schnall MD. MRI evaluation of the contralateral breast in women with recently diagnosed breast cancer. N Engl J Med. 2007;356(13):1295–1303. - PubMed
-
- Hollingsworth AB, Stough RG, O’Dell CA, Brekke CE. Breast magnetic resonance imaging for preoperative locoregional staging. Am J Surg. 2008;196(3):389–397. - PubMed
Publication types
MeSH terms
Substances
Grants and funding
LinkOut - more resources
Full Text Sources
Other Literature Sources
Medical
