. 2011 Feb;79(3):647-62.
doi: 10.1111/j.1365-2958.2010.07479.x. Epub 2010 Dec 13.

The cell cycle of Leishmania: morphogenetic events and their implications for parasite biology

Affiliations
Free PMC article

The cell cycle of Leishmania: morphogenetic events and their implications for parasite biology

Richard J Wheeler et al. Mol Microbiol. 2011 Feb.
Free PMC article

Abstract

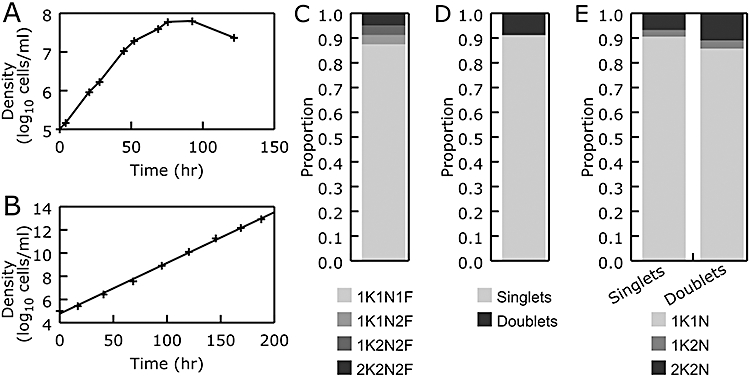
The cell cycle is central to understanding fundamental biology of Leishmania, a group of human-infective protozoan parasites. Leishmania have two main life cycle morphologies: the intracellular amastigote in the mammalian host and the promastigote in the fly. We have produced the first comprehensive and quantitative description of a Leishmania promastigote cell cycle taking a morphometric approach to position any cell within the cell cycle based on its length and DNA content. We describe timings of cell cycle phases and rates of morphological changes; kinetoplast and nucleus S phase, division and position, cell body growth and morphology changes, flagellum growth and basal body duplication. We have shown that Leishmania mexicana undergoes large changes in morphology through the cell cycle and that the wide range of morphologies present in cultures during exponential growth represent different cell cycle stages. We also show promastigote flagellum growth occurs over multiple cell cycles. There are clear implications for the mechanisms of flagellum length regulation, life cycle stage differentiation and trypanosomatid division in general. This data set therefore provides a platform which will be of use for post-genomic analyses of Leishmania cell biology in relation to differentiation and infection.


Figures

Fig. 1
Fig. 1
The cell cycle of promastigote L. mexicana by light microscopy. Micrographs of major cell cycle stages; cells were ordered based on number of kinetoplasts (K), nuclei (N) and flagella (F). The flagellum was labelled with the monoclonal antibody L8C4 which detects the PFR. Arrowed in (D) is the short new flagellum. Nuclear and kinetoplast DNA were labelled with DAPI. The kinetoplast and nucleus are indicated in (A). The scale bar represents 5 µm.
Fig. 2
Fig. 2
Logarithmic culture properties of L. mexicana.A. Growth curve of L. mexicana promastigotes at 28°C in M199 with 10% FCS, pH 7.4. Promastigotes grew logarithmically in the range 1 × 10⁵ to 1 × 10⁷ cells ml−1. Population growth slowed at densities of greater than 1 × 10⁷ cells ml−1 and ceases at approximately 8 × 10⁷ cell ml−1.B. Continued logarithmic growth of L. mexicana. Using repeated subculture to maintain promastigotes between 1 × 10⁶ and 1 × 10⁷ cells ml−1 gives rise to continuous logarithmic growth with a doubling time of 7.1 h.C. The proportions of nucleus (N), kinetoplast (K) and flagellum (F) configurations in cells undergoing logarithmic growth, n = 980.D. Approximately 10% of cells in logarithmic culture are connected via their posterior ends (doublets). The remainder are found as single cells (singlets), n = 1114.E. The proportions of nucleus and kinetoplast configurations for singlets and doublets are similar suggesting doublets progress through the cell cycle normally. Both cells in a doublet are universally found in the same K/N configuration. For singlets n = 942, for doublets n = 182.
Fig. 3
Fig. 3
Promastigote L. mexicana by scanning electron microscopy.A–D. Micrographs showing major morphologies of separated individual cells. (C) shows a cell with two flagella (arrows), (D) shows very late cytokinesis.E–H. Micrographs showing major morphologies of doublets which approximately correspond to cell morphologies in (A)–(D). The posterior-to-posterior connection is arrowed in (E). Note that the cells shown in (D) and (E) are morphologically indistinguishable and whether they would remain attached or undergo abscission is not clear.I. A quadriflagellate doublet with a clear view of four flagella of different lengths.The scale bars represent 5 µm.
Fig. 4
Fig. 4
Basic of morphology analysis of L. mexicana.A. A cartoon showing the properties of each cell measured for analysis; cell body length and width, kinetoplast and nucleus DAPI intensity, flagellum length and kinetoplast–anterior (K–A), nucleus–anterior (N–A) and nucleus–kinetoplast (N–K) separation.B–E. Cell body length and total DNA content of L. mexicana does not vary for densities in the range 3.0 × 10⁶ to 1.3 × 10⁷ cells ml−1 following growth from subculture to 1.0 × 10⁶. Flagellum lengths tend to be longer at higher densities. Cell widths tend to be lower at high densities. Boxes and error bars indicate the median, upper and lower quartiles and 95th percentiles. Stars indicate significant differences (P < 0.01, Student's t-test), no other differences are significant.F. Scatter plot of cell body length against total DNA content. Each data point represents one cell. Three cultures at three different densities were analysed, the different colours indicate the culture density for each data point. A best-fit line (black arrow) was used to generate an estimate of cell cycle progression for each cell. 3.0 × 10⁶ cells ml−1 data: n = 320, 5.0 × 10⁶ cells ml−1 data: n = 341, 1.3 × 10⁷ cells ml−1 data: n = 321.
Fig. 5
Fig. 5
Morphological variables plotted against an estimate of cell cycle progression.A and B. Scatter plots of cell length and width against calculated cell cycle progress. Each data point represents one cell. Colours indicate the culture density for each data point. This plot outlines the changes of the cell body shape over the course of the cell cycle. The rate of increase of cell length during G1 (≈ 1.7 µm h−1) and decrease in cell length during post-S phase (≈ 10 µm h−1) are indicated with black lines labelled G and C respectively. On average cells from a lower culture density have a larger width. Cells from all culture densities show an increase in width around the onset of mitosis and cytokinesis.C and D. Scatter plots of kinetoplast and nuclear DNA content against calculated cell cycle progress. These plots show the timings and rates of DNA synthesis. The S phases of the kinetoplast and nucleus are synchronous and the rate of DNA synthesis is indicated with the black lines labelled S.E and F. Scatter plots of old and new external flagellum length against calculated cell cycle progress. New flagellum growth starts towards the end of the cell cycle, the relationship between the old flagellum length and the cell cycle is complex. The rate of old flagellum growth during G1 (≈ 1 µm h−1) and new flagellum growth during the late cell cycle (≈ 3 µm h−1) are indicated with black lines labelled O and N respectively.The three vertical lines present in all plots indicate timings of major features, from left to right: the end of cell length growth and the start of DNA synthesis; the start of cell length contraction and new flagellum growth; and mitosis and cell width increase. 3.0 × 10⁶ cells ml−1 data: n = 320, 5.0 × 10⁶ cells ml−1 data: n = 340, 1.3 × 10⁷ cells ml−1 data: n = 320.
Fig. 6
Fig. 6
Time-lapse observation of single cells progressing through the cell cycle. Cells were trapped in 0.5% agarose to assist observation and a z-stack was captured every 1 min. The most in-focus slice was selected and rotated for every time point to give a constant cell orientation, one in five images (i.e. one image every 5 min) is shown here.A. A cell contracting in length and increasing in width to give a bi-lobed cytokinetic morphology before abscission. The two daughter cells remain trapped in the same liquid pocket within the agarose following division.B. Two cells, likely to be sister cells, growing in length. Both cells are growing in length at the same rate.For both (A) and (B) the brackets indicate the approximate position in the cell cycle (centre) of the cells in the time-lapse images. The scale bar represents 10 µm.
Fig. 7
Fig. 7
Asymmetries in promastigote L. mexicana division.A–F. Micrographs of cells during mitosis, kinetoplast division and cytokinesis arranged in order of cell cycle progress. Phase-contrast images are a single slice from a z-stack, DNA images show DAPI staining averaged over all slices of the z-stack. The kinetoplast and nucleus enter division on the old flagellum (OF) one side of the cell (A). During mitosis one nucleus is repositioned to the new flagellum (NF) side of the cell, this nucleus lies further towards the posterior end (left) of the cell (C, arrow). One daughter kinetoplast is positioned on the new flagellum side of the cell and initially lies perpendicular to its partner nucleus (E, arrow). All cells are orientated with the new flagellum on the lower half of the cell. The scale bar represents 5 µm.G. Bar graph showing old (black) and new (grey) flagellum length for 100 cells with two flagella (representative of 296 cells). Cells were arranged in order of increasing new flagellum length and the pairs of flagellum length were plotted. The old flagellum length (plotted next to the corresponding new flagellum) shows flagellum length variability and no clear relationship to new flagellum length.
Fig. 8
Fig. 8
The basal body duplication cycle. Electron microscopy of serial thin sections resolved the order of events in basal body duplication and early stages of new flagellum growth.A–C. Longitudinal sections through a 1K1N cell; the kinetoplast in this cell is associated with one basal body (B, arrow) subtending the single flagellum and one pro-basal body (C, arrowhead).D–F. Longitudinal sections through a 1K1N cell. The kinetoplast is elongated and filamentous lobes at each pole (marked with asterisks in E and F) indicate that it is in S-phase. This cell has two basal bodies (E, arrows), one at the proximal end of the old flagellum and one at the proximal end of the short new flagellum (still inside the flagellar pocket, Fig. S4). Two pro-basal bodies are positioned orthogonal to the basal bodies (E and F, arrowheads).G–I. Longitudinal sections through a 2K2N cell; both kinetoplasts in this cell are associated with one basal body (H and I, arrows) and one pro-basal body (H and I, arrowheads).J–L. Cross-sections of basal body/pro-basal body pairs.f, flagellum; k, kinetoplast; n, nucleus. Micrographs are shown at one of three magnifications; scale bar in (G) represents 1 µm (A, D and G are at the same magnification); scale bar in (I) represents 500 nm (B, C, E, F, H and I are at the same magnification) and scale bar in (L) represents 500 nm (J–L are at the same magnification).
Fig. 9
Fig. 9
Modelling of population flagellum length distributions.A–C. Cell body length, DNA content and cell cycle progress show complex correlations with flagellum length. n = 980.D–F. A simple model of flagellum growth based on the balance-point model where flagellum growth is driven by a cytoplasmic pool of flagellum components produced throughout the cell cycle (except S phase) give distributions that match the experimental data.G. A histogram of flagellum length of all cells during S phase (from the experimental data). The model of flagellum growth predicts a multi-modal distribution of S phase cells' flagellum lengths. The histogram of measured flagella lengths of S phase cells shows three peaks and confirms this prediction. n = 360.
Fig. 10
Fig. 10
The cell cycle of promastigote L. mexicana. Top left: cartoons of the major morphological forms occurring during the cell cycle and their approximate timing. Cell length increases during G1, remains constant during S phase and decreases for division. Flagellum length increases during G1 and remains constant during S phase. The new flagellum emerges from the flagellar pocket at the end of S phase but flagellum length at division is not equal giving rise to one daughter cell with a short flagellum (top right) and one daughter cell with a long flagellum (bottom right). Both daughter cells continue through the cell cycle normally. The approximate timings of pro-basal body formation (B1), pro-basal body rotation (B2) and the start of axoneme extension from the basal body (F1) are indicated. Bottom left: summary of the timing of DNA synthesis and division of the nucleus (N) and kinetoplast (K). S phases of the kinetoplast and nucleus are synchronous and take up a large proportion of the cell cycle. M indicates DNA segregation during mitotic anaphase, D indicates kinetoplast division. F2 indicates the emergence of the new flagellum from the flagellar pocket.

References

    1. Antoine J, Prina E, Courret N, Lang T. Leishmania spp.: on the interactions they establish with antigen-presenting cells of their mammalian hosts. Adv Parasitol. 2004;58:1–68. - PubMed
    1. Bastin P, Ellis K, Kohl L, Gull K. Flagellum ontogeny in trypanosomes studied via an inherited and regulated RNA interference system. J Cell Sci. 2000;113(Part 18):3321–3328. - PubMed
    1. Bates PA. Complete developmental cycle of Leishmania mexicana in axenic culture. Parasitology. 1994;108:1–9. - PubMed
    1. Bengs F, Scholz A, Kuhn D, Wiese M. LmxMPK9, a mitogen-activated protein kinase homologue affects flagellar length in Leishmania mexicana. Mol Microbiol. 2005;55:1606–1615. - PubMed
    1. Berriman M, Ghedin E, Hertz-Fowler C, Blandin G, Renauld H, Bartholomeu DC, et al. The genome of the African trypanosome Trypanosoma brucei. Science. 2005;309:416–422. - PubMed

Publication types