. 2011 Mar;33(5):831-42.
doi: 10.1111/j.1460-9568.2010.07576.x. Epub 2011 Jan 24.

Activation of the mitochondrial permeability transition pore modulates Ca2+ responses to physiological stimuli in adult neurons

Affiliations

Activation of the mitochondrial permeability transition pore modulates Ca2+ responses to physiological stimuli in adult neurons

Anna Barsukova et al. Eur J Neurosci. 2011 Mar.

Abstract

The participation of mitochondria in cellular and neuronal Ca(2+) homeostatic networks is now well accepted. Yet, critical tests of specific mitochondrial pathways in neuronal Ca(2+) responses have been hampered because the identity of mitochondrial proteins that must be integrated within this dynamic system remain uncertain. One putative pathway for Ca(2+) efflux from mitochondria exists through the formation of the permeability transition pore (PTP) that is often associated with cellular and neuronal death. Here, we have evaluated neuronal Ca(2+) dynamics and the PTP in single adult neurons in wild-type mice and those missing cyclophilin D (CyPD), a key regulator of the PTP. Using high-resolution time-lapse imaging, we demonstrate that PTP opening only follows simultaneous activation with two physiological stimuli that generate critical threshold levels of cytosolic and mitochondrial Ca(2+) . Our results are the first to demonstrate CyPD-dependent PTP opening in normal neuronal Ca(2+) homeostatic mechanisms not leading to activation of cell death pathways. As neurons in mice lacking CyPD are protected in a number of neurodegenerative disease models, the results suggest that improved viability of CyPD-knockout animals in these pathological states may be due to the transient, rather than persistent, activation of the PTP in mutant mitochondria, thereby shielding neurons from cytoplasmic Ca(2+) overload.


Figures

Fig. 1
Fig. 1
Cytosolic and mitochondrial Ca2+ responses following stimulation of adult cortical neurons prepared from WT and CyPD-KO mice with ATP and KCl alone. Neurons were perfused with 100 μm ATP or 90 mm KCl for 30 s. Cytosolic and mitochondrial Ca2+ levels were reported by fura-FF and mitoRP, respectively. (A) Representative traces of cytosolic Ca2+ responses to ATP. (B) Quantification of cytosolic Ca2+ levels prior to stimulation (Untreated) and at peak (ATP), P > 0.05. (C) Representative traces of mitochondrial Ca2+ responses in response to ATP. (D) Quantification of mitochondrial Ca2+ levels prior to stimulation (Untreated) and at peak (ATP), P > 0.05. (E) Representative traces of cytosolic Ca2+ responses to KCl. (F) Quantification of cytosolic Ca2+ levels prior to stimulation (Untreated) and at peak (KCl), P > 0.05. (G) Representative traces of mitochondrial Ca2+ responses to KCl. (H) Quantification of mitochondrial Ca2+ levels prior to stimulation (Untreated) and at peak (KCl), P > 0.05.
Fig. 2
Fig. 2
Cytosolic and mitochondrial Ca2+ responses following simultaneous stimulation with ATP and depolarization in adult cortical neurons prepared from WT and CyPD-KO mice. Neurons were perfused with 100 μm ATP and 90 mm KCl for 30 s. Cytosolic and mitochondrial Ca2+ levels were reported by fura-FF and mitoRP, respectively. (A) Representative traces of cytosolic Ca2+ responses. (B) Quantification of cytosolic Ca2+ retention following ATP and KCl stimulation. Bars represent cytosolic Ca2+ levels at 0.9, 1.1 and 1.3 min, at peak, **P < 0.01. (C) Representative traces of mitochondrial Ca2+ levels. (D) Quantification of mitochondrial Ca2+ retention following ATP and KCl stimulation. Bars represent mitochondrial Ca2+ levels at 0.7, 0.9, 1.1 and 1.3 min, **P < 0.01. (E) Pretreatment with the mitochondrial uncoupler FCCP (450 nm) for 3 min abolishes mitochondrial Ca2+ in neurons following perfusion with ATP and KCl. (F) Stimulation with ATP and KCl does not affect neuronal viability in adult cortical neurons prepared from WT and CyPD-KO mice. Neurons were perfused with 100 μm ATP and 90 mm KCl for 30 s and viability was assessed relative to untreated controls 24 h after stimulation. Neuronal viability was assessed as outlined in the Methods. Bars represent the total number of live neurons in five random fields of view per cover slip using a 20 × objective, P > 0.05.
Fig. 3
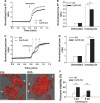
Fig. 3
Cytosolic and mitochondrial Ca2+ levels, mitochondrial morphology and neuronal viability of adult WT and CyPD-KO neurons following exposure to ionomycin. The responses were reported by fura-FF, mitoRP, TMRM, mitoPBRf and Calcein-AM, respectively. Neurons were perfused with 5 μm ionomycin for 30 s. (A) Representative traces of cytosolic Ca2+ responses. (B) Quantification of cytosolic Ca2+ levels prior to stimulation (Untreated) and at 0.8 min (Ionomycin), **P < 0.01. (C) Representative traces of mitochondrial Ca2+ responses. Mitochondrial Ca2+ saturation in WT neurons occurred earlier that in CyPD-KO neurons (compare times indicated by line 2), both followed immediately by accumulation of similar maximal levels of Ca2+. (D) Quantification of mitochondrial Ca2+ levels prior to stimulation (Untreated) and at point 2 in C (0.8 min, Ionomycin), **P < 0.01. (Ei,ii) Uncropped images (magnification 240 ×, oil-immersion) of the neuronal soma region containing clusters of mitochondria show differences in the onset of mitochondrial swelling in WT (i) and CyPD-KO (ii) neurons, corresponding to the difference in Ca2+ accumulation at point 2 in C. Red outlines represent expanding (i) or normal (ii) outer border of mitochondria using deconvolution, 3D reconstruction and 3D edge detection. Arrows show single mitochondrion with swollen (i) and with normal morphology (ii) in WT and CyPD-KO neurons, respectively. Scale bar = 5 μm. (F) Neuronal viability relative to untreated controls following perfusion with 1 or 5 μm ionomycin for 30 s and viability assessed after 24 h, **P < 0.01. Bars represent percentage of viable neurons in random fields of view using a 20 × objective (n = 40 fields of view from eight cover slips per each group).
Fig. 4
Fig. 4
Mitochondrial Ca2+ responses following simultaneous stimulation with ATP and depolarization in WT and CyPD-KO adult cortical neurons treated with CsA. Neurons were pretreated with 10 μm CsA for 30 min and then perfused with 100 μm ATP and 90 mm KCl for 30 s. Mitochondrial Ca2+ levels were reported by mitoRP. (A) Representative traces of mitochondrial Ca2+ responses in WT neurons treated with CsA. (B) Representative traces of mitochondrial Ca2+ responses in CyPD-KO neurons treated with CsA. (C) Quantification of mitochondrial Ca2+ retention in WT and WT cells treated with CsA following ATP and KCl stimulation. Bars represent mitochondrial Ca2+ levels at 0.7, 0.9, 1.1 and 1.3 min, **P < 0.01.
Fig. 5
Fig. 5
Mitochondrial membrane potential in response to simultaneous stimulation with ATP and depolarization, and exposure to ionomycin in adult cortical neurons prepared from adult WT and CyPD-KO mice. Neurons were perfused with 100 μm ATP and 90 mm KCl for 30 s. Mitochondrial membrane potential was reported by TMRM. (A) Representative traces of Δψ following stimulation with ATP and KCl. (B) Traces demonstrating that Δψ in WT cells returns to baseline following transient stimulation with ATP and KCl (ATP + KCl). (C) Quantification of Δψ at baseline (Untreated) and at 2 min in response to ATP and KCl (ATP + KCl), **P < 0.01. (D) Quantification of Δψ at baseline (Untreated) and at 5 min in response to ATP and KCl (ATP + KCl), P > 0.05.

References

    1. Abramov AY, Duchen MR. Mechanisms underlying the loss of mitochondrial membrane potential in glutamate excitotoxicity. Biochim. Biophys. Acta. 2008;1777:953–964. - PubMed
    1. Baines CP, Kaiser RA, Purcell NH, Blair NS, Osinska H, Hambleton MA, Brunskill EW, Sayen MR, Gottlieb RA, Dorn GW, Robbins J, Molkentin JD. Loss of cyclophilin D reveals a critical role for mitochondrial permeability transition in cell death. Nature. 2005;434:658–662. - PubMed
    1. Basso E, Fante L, Fowlkes J, Petronilli V, Forte MA, Bernardi P. Properties of the permeability transition pore in mitochondria devoid of cyclophilin D. J. Biol. Chem. 2005;280:18558–18561. - PubMed
    1. Bernardi P. Mitochondrial transport of cations: channels, exchangers, and permeability transition. Physiol. Rev. 1999;79:1127–1155. - PubMed
    1. Bernardi P, Petronilli V. The permeability transition pore as a mitochondrial calcium release channel: a critical appraisal. J. Bioenerg. Biomembr. 1996;28:131–138. - PubMed

Publication types