

Adaptive evolution of baker's yeast in a dough-like environment enhances freeze and salinity tolerance
- PMID: 21255321
- PMCID: PMC3836578
- DOI: 10.1111/j.1751-7915.2009.00136.x
Adaptive evolution of baker's yeast in a dough-like environment enhances freeze and salinity tolerance
Abstract
We used adaptive evolution to improve freeze tolerance of industrial baker's yeast. Our hypothesis was that adaptation to low temperature is accompanied by enhanced resistance of yeast to freezing. Based on this hypothesis, yeast was propagated in a flour-free liquid dough model system, which contained sorbitol and NaCl, by successive batch refreshments maintained constantly at 12°C over at least 200 generations. Relative to the parental population, the maximal growth rate (µ(max)) under the restrictive conditions, increased gradually over the time course of the experiment. This increase was accompanied by enhanced freeze tolerance. However, these changes were not the consequence of genetic adaptation to low temperature, a fact that was confirmed by prolonged selection of yeast cells in YPD at 12°C. Instead, the experimental populations showed a progressive increase in NaCl tolerance. This phenotype was likely achieved at the expense of others traits, since evolved cells showed a ploidy reduction, a defect in the glucose derepression mechanism and a loss in their ability to utilize gluconeogenic carbon sources. We discuss the genetic flexibility of S. cerevisiae in terms of adaptation to the multiple constraints of the experimental design applied to drive adaptive evolution and the technologically advantageous phenotype of the evolved population.
Figures
 ), 100‐ (
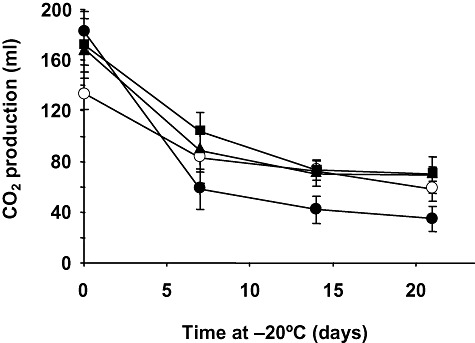
 ) and 200‐generation (○) evolved populations were transferred to LD medium and total CO2 production at 30°C was measured before (control, time 0) and after freezing and frozen storage at −20°C for 7, 14 or 21 days. The amount of CO2 produced for 180 min at 30°C was recorded in a home‐made fermentometer. Frozen samples were thawed at 30°C for 30 min before measuring gassing power. Values are expressed as ml of CO2 per sample. In all cases, values represent the means of at least three independent experiments. The error associated with the points was calculated by using the formula:
  , where n is the number of measurements. Additional details are given in the Experimental procedures section.
References
-
- Aguilera J., Randez‐Gil F., Prieto J.A. Cold response in Saccharomyces cerevisiae: new functions for old mechanisms. FEMS Microbiol Rev. 2007;31:327–341. - PubMed
-
- Attfield P.V. Stress tolerance: the key to effective strains of industrial baker's yeast. Nat Biotechnol. 1997;15:1351–1357. - PubMed
-
- Cooper V.S., Lenski R.E. The population genetics of ecological specialization in evolving Escherichia coli populations. Nature. 2000;407:736–739. - PubMed
Publication types
MeSH terms
Substances
LinkOut - more resources
Full Text Sources
Molecular Biology Databases
