

P wave duration and risk of longitudinal atrial fibrillation in persons ≥ 60 years old (from the Framingham Heart Study)
- PMID: 21255761
- PMCID: PMC3049849
- DOI: 10.1016/j.amjcard.2010.10.075
P wave duration and risk of longitudinal atrial fibrillation in persons ≥ 60 years old (from the Framingham Heart Study)
Abstract
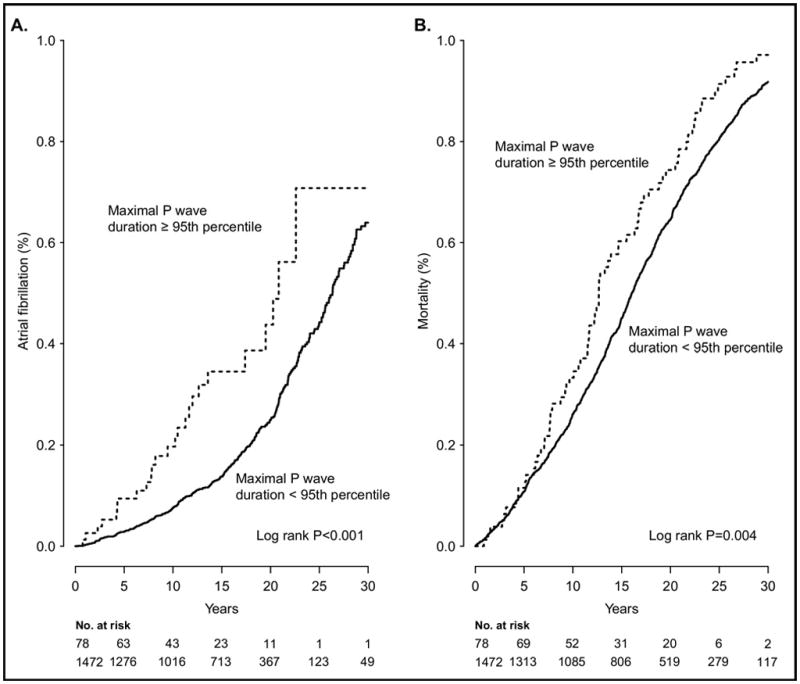
Long-term risk prediction is a priority for the prevention of atrial fibrillation (AF). P wave indices are electrocardiographic measurements describing atrial conduction. The role of P wave indices in the prospective determination of AF and mortality risk has had limited assessment. We quantified by digital caliper the P wave indices of maximum duration and dispersion in 1,550 Framingham Heart Study participants ≥ 60 years old (58% women) from single-channel electrocardiograms recorded from 1968 through 1971. We examined the association of selected P wave indices and long-term outcomes using Cox proportional hazards regression incorporating age, gender, body mass index, systolic blood pressure, treatment for hypertension, significant murmur, heart failure, and PR interval. Over a median follow-up of 15.8 years (range 0 to 38.7), 359 participants developed AF and 1,525 died. Multivariable-adjusted hazard ratios (HRs) per SD increase in maximum P wave duration were 1.15 (95% confidence interval [CI] 0.90 to 1.47, p = 0.27) for AF and 1.02 (95% CI 0.96 to 1.08, p = 0.18) for mortality. The upper 5% of P wave maximum duration had a multivariable-adjusted HR of 2.51 (95% CI 1.13 to 5.57, p = 0.024) for AF and an HR of 1.11 (95% CI 0.87 to 1.40, p = 0.20) for mortality. We found no significant associations between P wave dispersion with incidence of AF or mortality. In conclusion, maximum P wave duration at the upper fifth percentile was associated with long-term AF risk in an elderly community-based cohort. P wave duration is an electrocardiographic endophenotype for AF.
Copyright © 2011 Elsevier Inc. All rights reserved.
Figures
Comment in
-
P-wave dispersion and atrial fibrillation risk: methodological considerations.Am J Cardiol. 2011 May 1;107(9):1405. doi: 10.1016/j.amjcard.2011.02.001. Am J Cardiol. 2011. PMID: 21497213 No abstract available.
References
-
- Kannel WB, Feinleib M, McNamara PM, Garrison RJ, Castelli WP. An investigation of coronary heart disease in families. The Framingham Offspring Study. Am J Epidemiol. 1979;110:281–290. - PubMed
-
- Sagie A, Larson MG, Goldberg RJ, Bengtson JR, Levy D. An improved method for adjusting the QT interval for heart rate (the Framingham Heart Study) Am J Cardiol. 1992;70:797–801. - PubMed
-
- Badilini F, Sarapa N. Implications of methodological differences in digital electrocardiogram interval measurement. J Electrocardiol. 2006;39(suppl):S152–S156. - PubMed
-
- Kligfield P, Badilini F, Brown B, Helfenbein E, Kohls M. The ISCE ECG genome pilot challenge: a 2004 progress report. J Electrocardiol. 2004;37(suppl):144–148. - PubMed
Publication types
MeSH terms
Grants and funding
- N01-HC-25195/HC/NHLBI NIH HHS/United States
- R21 DA027021/DA/NIDA NIH HHS/United States
- K24 HL105780/HL/NHLBI NIH HHS/United States
- R01 HL092577/HL/NHLBI NIH HHS/United States
- RC1 HL101056/HL/NHLBI NIH HHS/United States
- RC1HL101056/HL/NHLBI NIH HHS/United States
- L30 HL097675/HL/NHLBI NIH HHS/United States
- N01 HC025195/HL/NHLBI NIH HHS/United States
- R01 HL102214/HL/NHLBI NIH HHS/United States
- 1R01HL102214/HL/NHLBI NIH HHS/United States
- HL092577/HL/NHLBI NIH HHS/United States
- 1HL104156/HL/NHLBI NIH HHS/United States
- R01 HL104156/HL/NHLBI NIH HHS/United States
LinkOut - more resources
Full Text Sources
Medical
Research Materials
