

Noninvasive evaluation of hepatic fibrosis using acoustic radiation force-based shear stiffness in patients with nonalcoholic fatty liver disease
- PMID: 21256907
- PMCID: PMC3092839
- DOI: 10.1016/j.jhep.2010.12.019
Noninvasive evaluation of hepatic fibrosis using acoustic radiation force-based shear stiffness in patients with nonalcoholic fatty liver disease
Abstract
Background & aims: Nonalcoholic fatty liver disease (NAFLD), the most common form of chronic liver disease in developed countries, may progress to nonalcoholic steatohepatitis (NASH) in a minority of people. Those with NASH are at increased risk for cirrhosis and hepatocellular carcinoma. The potential risk and economic burden of utilizing liver biopsy to stage NAFLD in an overwhelmingly large at-risk population are enormous; thus, the discovery of sensitive, inexpensive, and reliable noninvasive diagnostic modalities is essential for population-based screening.
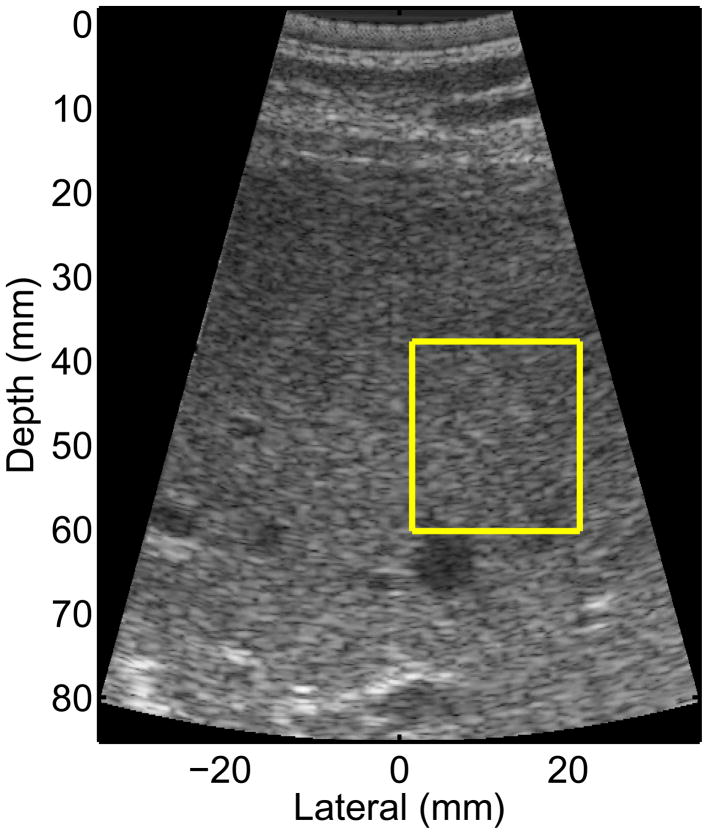
Methods: Acoustic Radiation Force Impulse (ARFI) shear wave imaging, a noninvasive method of assessing tissue stiffness, was used to evaluate liver fibrosis in 172 patients diagnosed with NAFLD. Liver shear stiffness measures in three different imaging locations were reconstructed and compared to the histologic features of NAFLD and AST-to-platelet ratio indices (APRI).
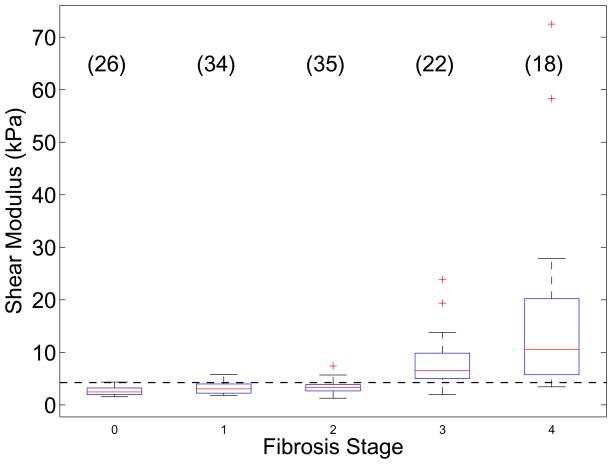
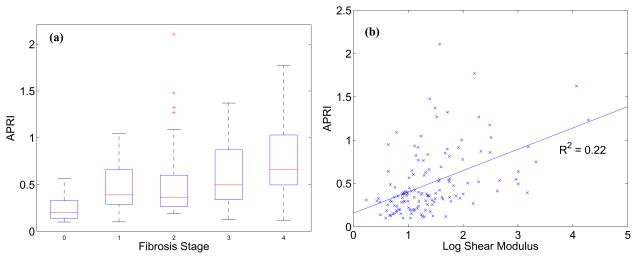
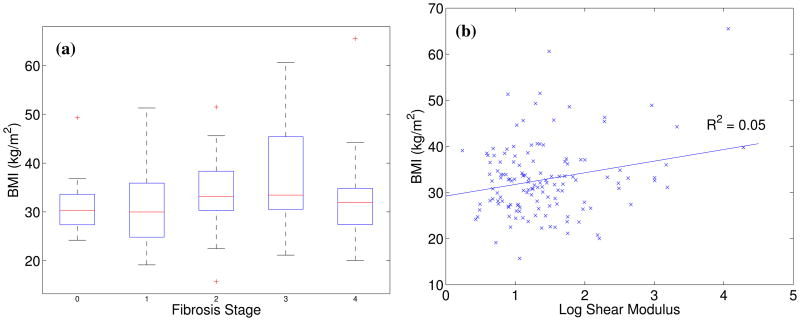
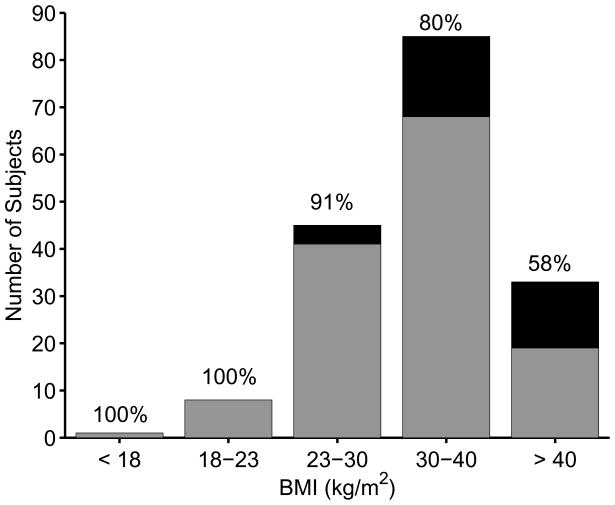
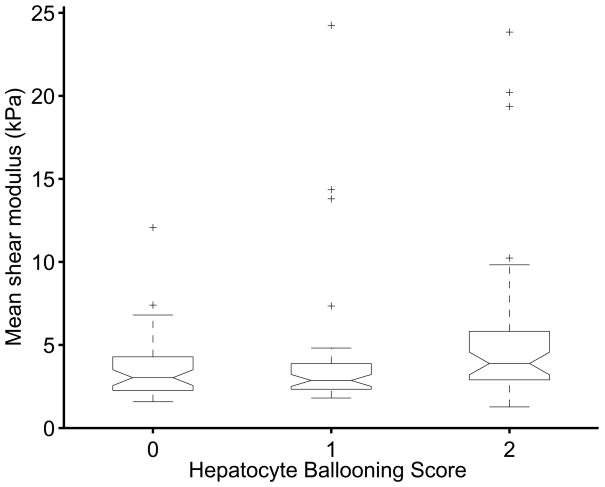
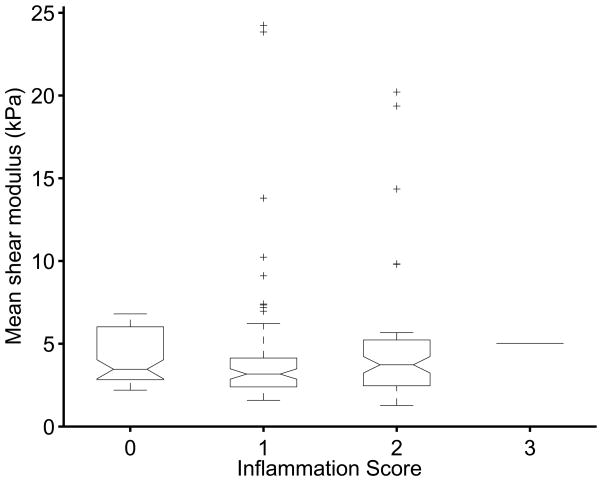
Results: Reconstructed shear stiffnesses were not associated with ballooned hepatocytes (p=0.11), inflammation (p=0.69), nor imaging location (p=0.11). Using a predictive shear stiffness threshold of 4.24kPa, shear stiffness distinguished low (fibrosis stage 0-2) from high (fibrosis stage 3-4) fibrosis stages with a sensitivity of 90% and a specificity of 90% (AUC of 0.90). Shear stiffness had a mild correlation with APRI (R(2)=0.22). BMI>40kg/m(2) was not a limiting factor for ARFI imaging, and no correlation was noted between BMI and shear stiffness (R(2)=0.05).
Conclusions: ARFI imaging is a promising imaging modality for assessing the presence or absence of advanced fibrosis in patients with obesity-related liver disease.
Copyright © 2011 European Association for the Study of the Liver. Published by Elsevier B.V. All rights reserved.
Figures
Comment in
-
Acoustic radiation force-based shear stiffness and non-invasive panels of tests in Japanese patients with nonalcoholic fatty liver disease.J Hepatol. 2012 Mar;56(3):740-1. doi: 10.1016/j.jhep.2011.07.021. Epub 2011 Aug 30. J Hepatol. 2012. PMID: 21884671 No abstract available.
References
-
- Angulo P. Nonalcoholic fatty liver disease. N Engl J Med. 2002;346:1221–1231. - PubMed
-
- Wieckowska A, Feldstein AE. Nonalcoholic fatty liver disease in the pediatric population: a review. Curr Opin Pediatr. 2005;17:636–641. - PubMed
-
- Szczepaniak LS, Nurenberg P, Leonard D, Browning JD, Reingold JS, Grundy S, et al. Magentic resonance spectroscopy to measure hepatic triglyceride content: prevalence of hepatic steatosis in the general population. Am J Physiol Endocinol Metab. 2004;288:E462–8. - PubMed
-
- Brunt EM, Janney CG, Di Biceglie AM, Neuschwander-Tetri BA, Bacon BR. Nonalcoholic steatohepatitis: a proposal for grading and staging the histological lesions. Am J Gastroenterology. 1999;94:2467–2474. - PubMed
-
- Matteoni CA, Younossi ZM, Gramlich T, Liu Y, Rybicki L, McCullough AJ. Nonalcoholic fatty liver disease: Risk factors and long-term outcomes for benign versus aggressive disease. Gastroenterology. 1998;114:1413–1419.
Publication types
MeSH terms
Substances
Grants and funding
LinkOut - more resources
Full Text Sources
Other Literature Sources
Medical
