. 2011 Mar;36(2):115-24.
doi: 10.1016/j.jaut.2010.12.003. Epub 2011 Jan 22.

Neuroantigen-specific CD8+ regulatory T-cell function is deficient during acute exacerbation of multiple sclerosis

Affiliations

Neuroantigen-specific CD8+ regulatory T-cell function is deficient during acute exacerbation of multiple sclerosis

Ethan J Baughman et al. J Autoimmun. 2011 Mar.

Abstract

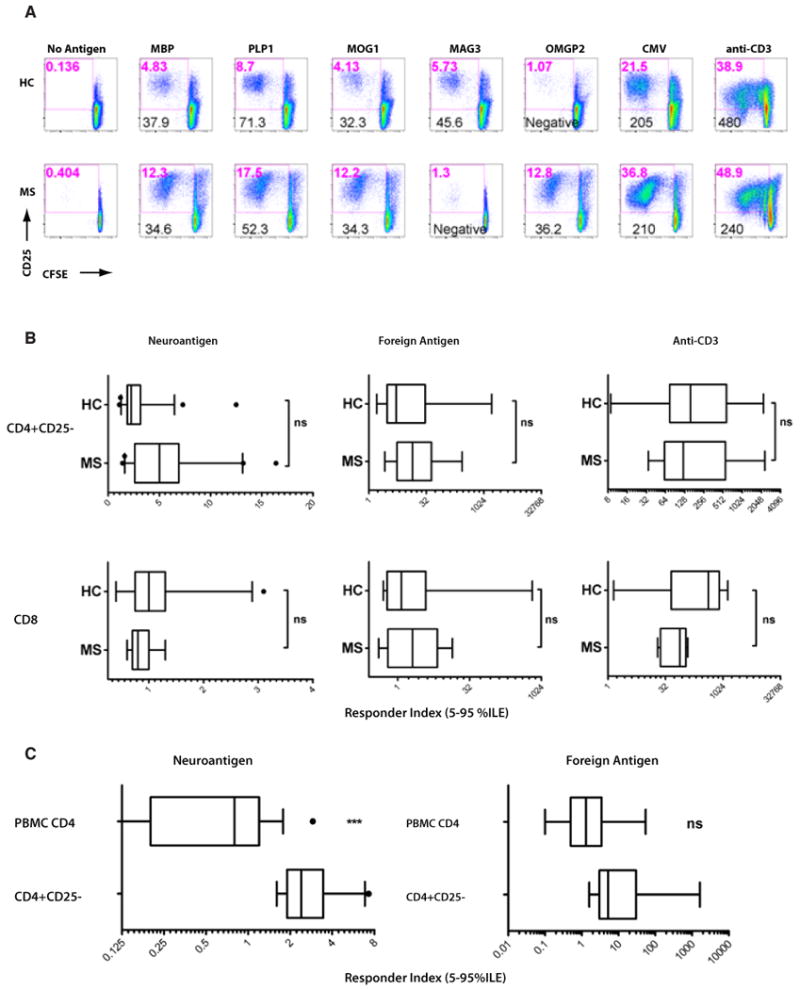
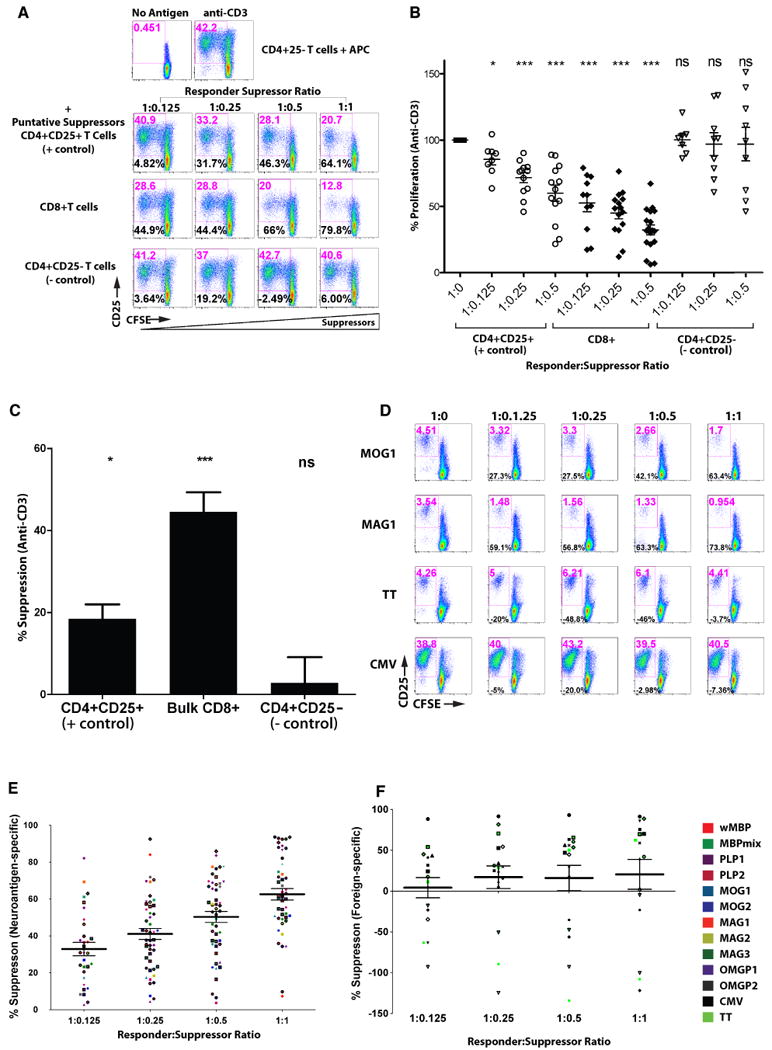
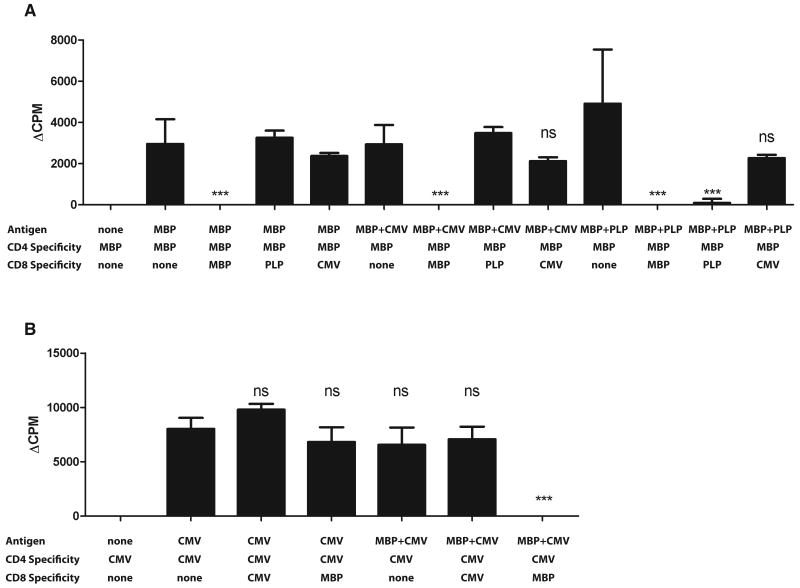
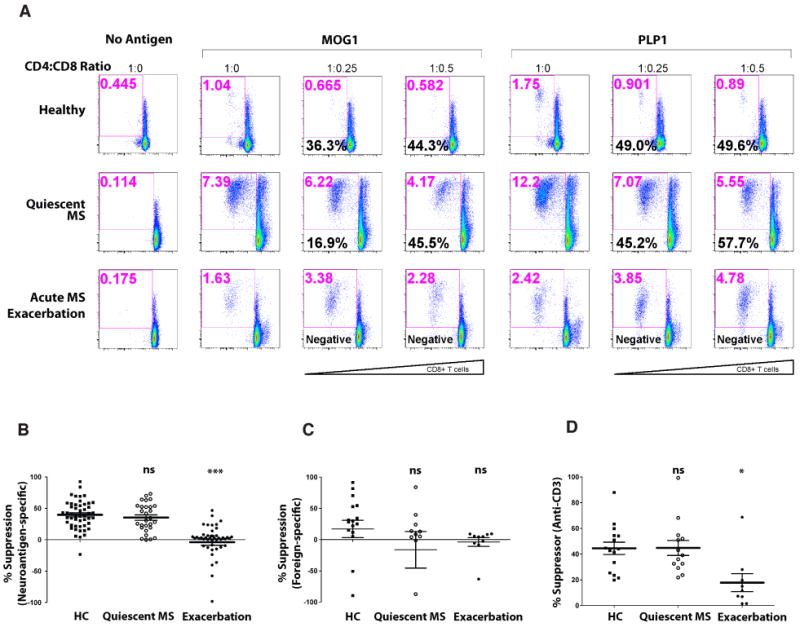
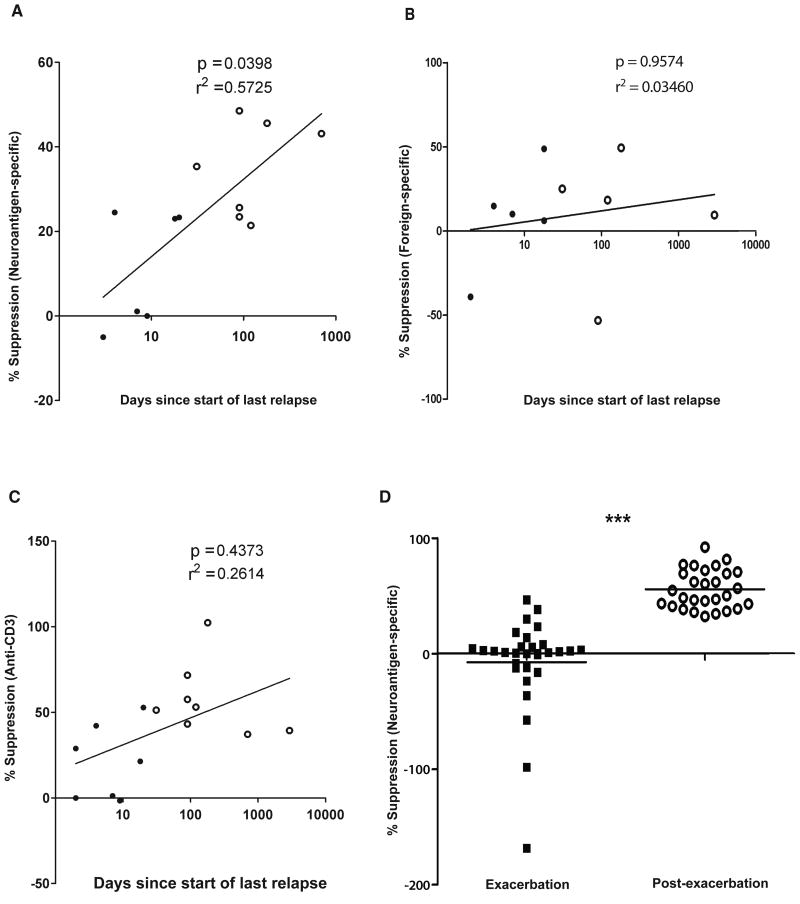
Multiple sclerosis (MS) is an inflammatory, demyelinating disease of the central nervous system (CNS). MS is thought to be T-cell-mediated, with prior research predominantly focusing on CD4+ T-cells. There is a high prevalence of CNS-specific CD8+ T-cell responses in MS patients and healthy subjects. However, the role of neuroantigen-specific CD8+ T-cells in MS is poorly understood, with the prevalent notion that these may represent pathogenic T-cells. We show here that healthy subjects and MS patients demonstrate similar magnitudes of CD8+ and CD4+ T-cell responses to various antigenic stimuli. Interestingly, CD8+ T-cells specific for CNS autoantigens, but not those specific for control foreign antigens, exhibit immune regulatory ability, suppressing proliferation of CD4+CD25- T-cells when stimulated by their cognate antigen. While CD8+ T-cell-mediated immune suppression is similar between healthy subjects and clinically quiescent treatment-naïve MS patients, it is significantly deficient during acute exacerbation of MS. Of note, the recovery of neuroantigen-specific CD8+ T-cell suppression correlates with disease recovery post-relapse. These studies reveal a novel immune suppressor function for neuroantigen-specific CD8+ T-cells that is clinically relevant in the maintenance of peripheral tolerance and the intrinsic regulation of MS immune pathology.


Figures

Figure 1
Figure 1. Multiple sclerosis patients and healthy control subjects share similar T-cell responses. CFSE-based proliferation assays were performed on purified CD4+CD25- or CD8+ T-cells from 15 HC and 11 MS patients
(A) Representative responses from CD4+ T-cells from a single HC (top row) and single MS patient (bottom row) are shown, with CFSE on X-axis and CD25 on the Y-axis. Various stimuli are indicated above each column. The numbers in red toward the top of each dotplot indicate the %CD25+/CFSE(low) (activated/proliferating) cells, representing the response. Numbers in black toward the bottom represent the response index (RI), calculated based on background proliferation in the absence of any stimulus. “Negative” represents lack of a response, based on criteria described in the methods. (B) Cumulative results from 15 HC and 11 MS patients (9 neuroantigenic responders) are shown as RI for both CD4 responses (top row) and CD8 responses (bottom row), stimulated with neuroantigens, foreign antigens or anti-CD3 (as indicated). These results represent 85 and 60 positive assays with neuroantigens performed on HC and MS, respectively. (C) From 9 HC, CFSE-based proliferation assays were performed on both bulk PBMC as well as sorted CD4+CD25- T-cells. Cumulative results from gated CD4 responses from each condition are shown as RI. *** indicates significant elevation of neuroantigen-specific responses (p<0.001), whereas foreign antigen-specific responses were not significantly different (ns).
Figure 2
Figure 2. Anti-CD3-stimulated and neuroantigen-specific CD8+ T-cells suppress CD4+ T-cells
(A) CFSE-stained healthy ex vivo purified CD4+CD25- T-cells were used as responders in anti-CD3-stimulated suppression assays. Dotplots from a single representative experiment demonstrate CFSE on the X-axis and CD25 expression on Y-axis. Indicated in red at the top of each dot plot is the gated percentage of CD25+/CFSE-low cells (activated and proliferating), representing the “response”. Indicated in black in the lower left is the calculated %suppression, based on normalizing to the anti-CD3-mediated response in the absence of suppressors (top row). Indicated to the left of the bottom three rows are the CMTPX-stained cell populations used as suppressors at the indicated ratios over each column. The results are representative of 15 flow-based suppression assays from 15 healthy controls. (B) Cumulative results from suppression assays from 15 healthy controls are displayed as percent proliferative response normalized to the response without suppressors (defined as 100%), indicated as 1:0. Open circles represent the response in the presence of increasing numbers of CD4+CD25+ T-cells (positive controls), closed diamonds for bulk CD8+ T-cells and open triangles for CD4+CD25- T-cells (negative controls). (C) Results from Panel B are represented as %suppression at a single responder: suppressor ratio (1:0.25). (D) Representative dotplots from a single subject demonstrate CD8-mediated suppression assays in the presence of neuroantigens (MOG1, MAG1) and foreign antigen (TT, CMV). The left column represents CD4+CD25- responders only, where positive responses were selected to evaluate suppression. The right three columns contain increasing numbers of CMTPX-stained CD8+ T-cells, with %proliferation and %suppression indicated. (E, F) Cumulative results are shown from 67 suppression assays. Data points represent neuroantigen- (E) and foreign antigen- (F) specific %suppression. Each of 15 subjects is indicated by a different shape. Neuroantigen or foreign antigen used in the suppression assay is indicated by the color legend at right (for some proteins, multiple pools were made to limit the number of peptides in each pool, as described previously [3]).
Figure 3
Figure 3. Activated neuroantigen-specific CD8+ T-cells suppress CD4+ T-cells
Responder CD4+ T-cell lines were cultured with APC and indicated antigens in the presence or absence of the indicated CD8+ T-cell lines. 3H-Thymidine-based proliferation assays were performed. Panel A shows ΔCPM (background subtracted) from a single MBP-specific CD4+ line and Panel B shows a CMV-specific CD4+ line. The results are representative of 8 independent assays, each repeated twice, with lines obtained from 8 different HC.
Figure 4
Figure 4. Neuroantigen-specific suppressive ability is deficient during acute MS exacerbation
Ex vivo-purified, CFSE-stained CD4+CD25- T-cells from HC, quiescent MS patients or MS patients suffering from an acute exacerbation were used as responders in autologous suppression assays. Panel A shows CFSE vs. CD25 dotplots from representative subjects responding to two neuroantigens (MOG-pool 1 and PLP-pool 1) in the absence of suppressor cells (1:0) or with CD8+ T-cells added at indicated ratios. Red numbers at the top of each dotplot represent proliferative response, whereas the black numbers represent the calculated %suppression. This is representative 15 HC, 11 quiescent MS patients (9 responders) and 9 acute MS exacerbation patients (6 responders), equivalent to 50, 47, and 37 flow-based suppression assays, respectively. Panels B, C and D show cumulative %suppression data at the 1:0.25 responder:suppressor ratio from assays containing neuroantigens, foreign antigens or anti-CD3, as indicated.
Figure 5
Figure 5. Neuroantigen-specific CD8+ T-cell suppressive-ability correlates with days since last relapse and recovery
(A, B, C) Dots represent average CD8+ T-cell suppressive ability of individual MS patients in the presence of neuroantigens (A), foreign antigens (B) or anti-CD3 (C). Closed and open circles are acute MS exacerbation and quiescent MS patients, respectively. R squared values are shown for nonlinear regression assuming a semi-log X line model. P values are shown for correlation analysis. (D) Dots represent neuroantigen-specific suppression assays performed longitudinally during exacerbation and after a quiescent clinical state as reached. Closed squares and open circles represent patients who averaged 12 and 81 days since start of last relapse, respectively.

References

    1. McFarland HF, Martin R. Multiple sclerosis: a complicated picture of autoimmunity. Nat Immunol. 2007;8:913–9. - PubMed
    1. Arbour N, Holz A, Sipe JC, Naniche D, Romine JS, Zyroff J, et al. A new approach for evaluating antigen-specific T cell responses to myelin antigens during the course of multiple sclerosis. J Neuroimmunol. 2003;137:197–209. - PMC - PubMed
    1. Crawford MP, Yan SX, Ortega SB, Mehta RS, Hewitt RE, Price DA, et al. High prevalence of autoreactive, neuroantigen-specific CD8+ T cells in multiple sclerosis revealed by novel flow cytometric assay. Blood. 2004;103:4222–31. - PubMed
    1. Babbe H, Roers A, Waisman A, Lassmann H, Goebels N, Hohlfeld R, et al. Clonal expansions of CD8(+) T cells dominate the T cell infiltrate in active multiple sclerosis lesions as shown by micromanipulation and single cell polymerase chain reaction. J Exp Med. 2000;192:393–404. - PMC - PubMed
    1. Huseby ES, Liggitt D, Brabb T, Schnabel B, Ohlen C, Goverman J. A pathogenic role for myelin-specific CD8(+) T cells in a model for multiple sclerosis. J Exp Med. 2001;194:669–76. - PMC - PubMed

Publication types

MeSH terms