. 2011 Apr;102(4):436-47.
doi: 10.1016/j.ymgme.2010.12.014. Epub 2010 Dec 31.

Accumulation and distribution of α-synuclein and ubiquitin in the CNS of Gaucher disease mouse models

Affiliations

Accumulation and distribution of α-synuclein and ubiquitin in the CNS of Gaucher disease mouse models

Y H Xu et al. Mol Genet Metab. 2011 Apr.

Abstract

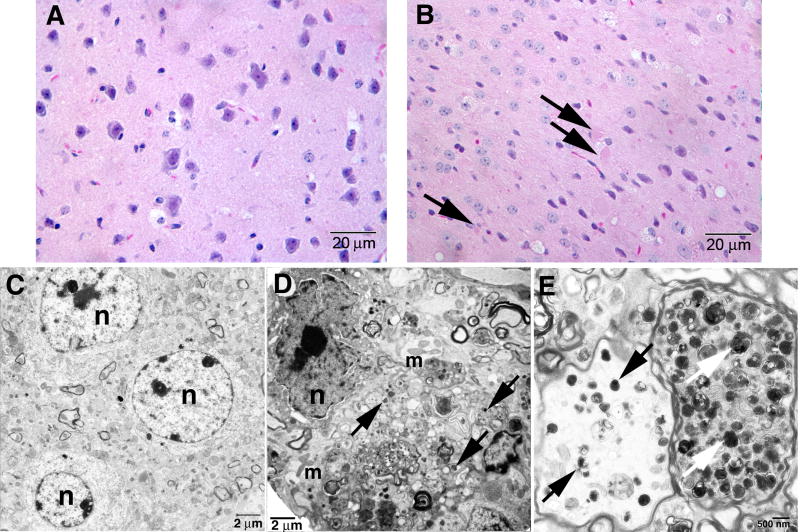
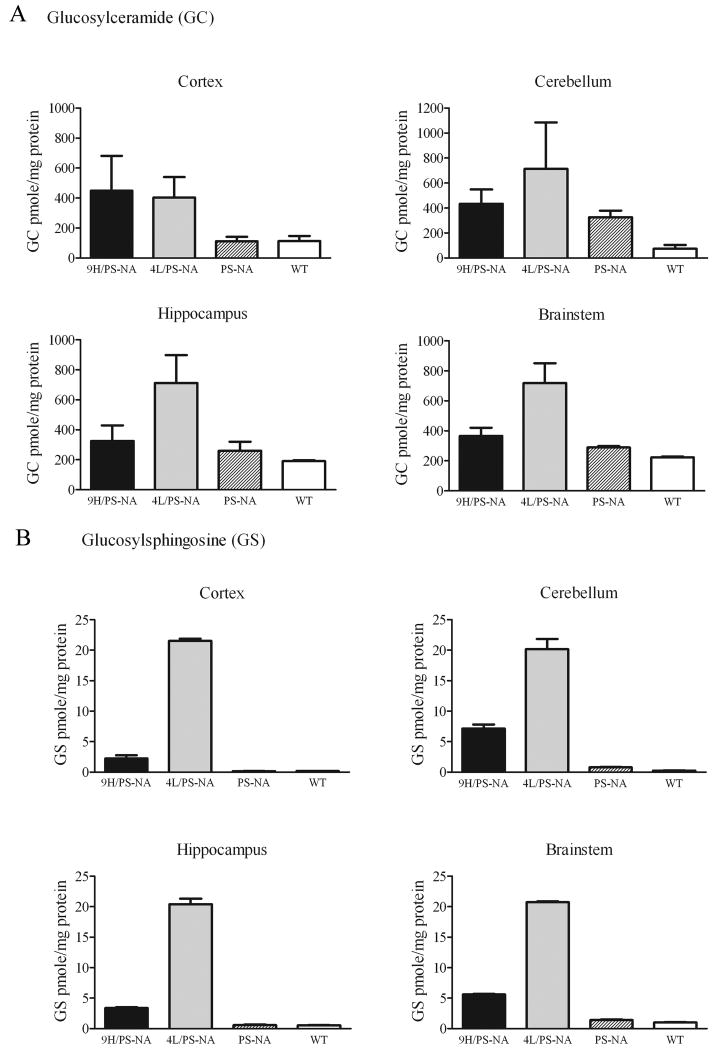
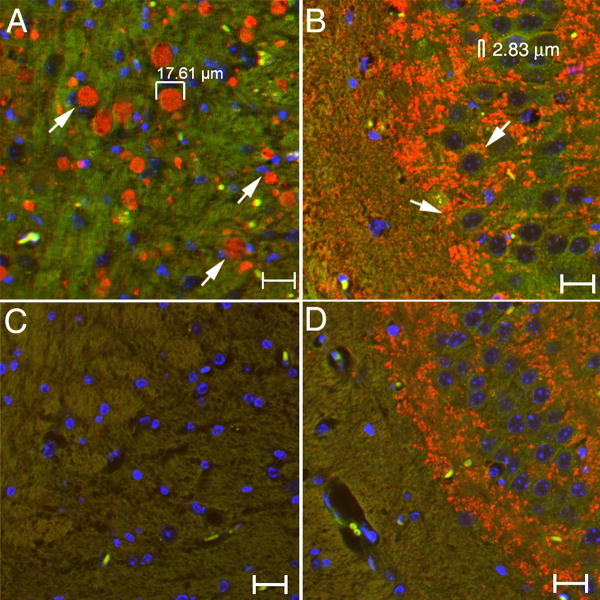
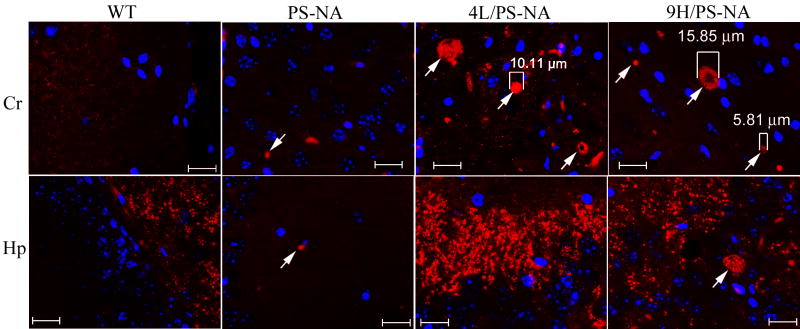
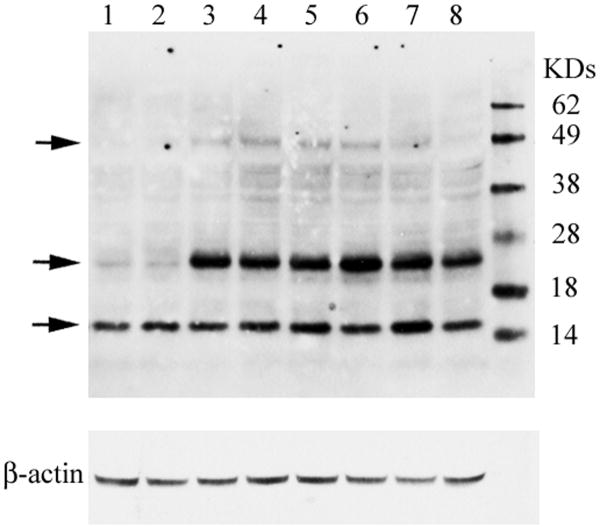
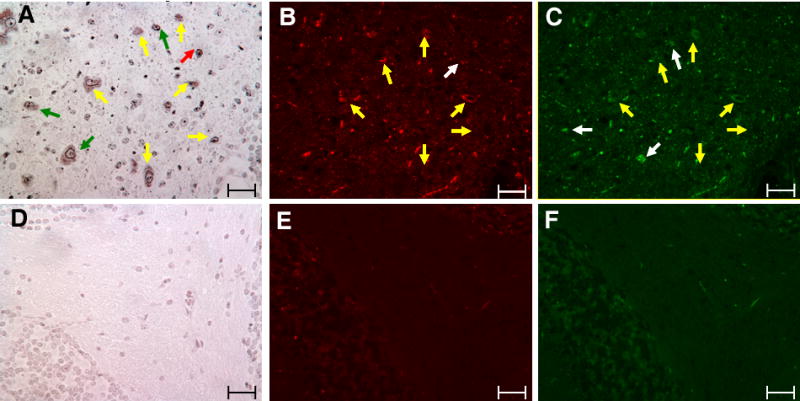
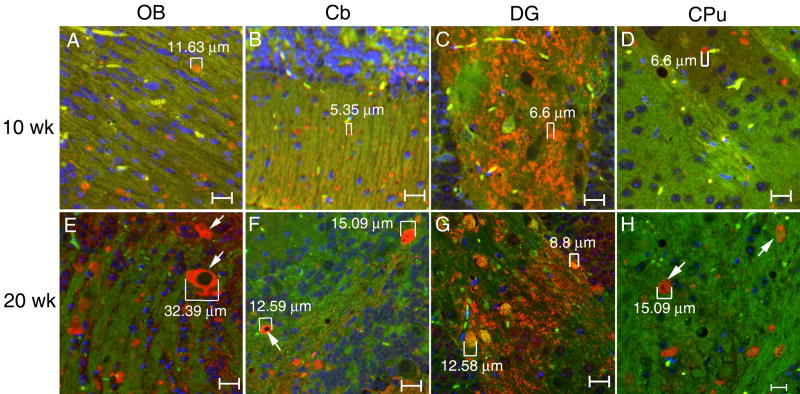
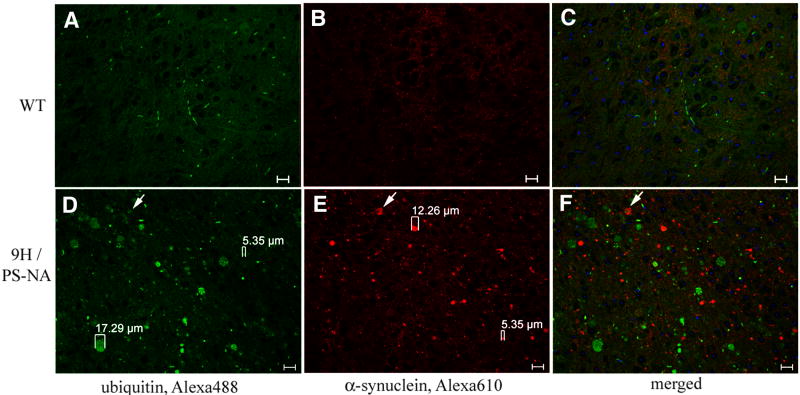
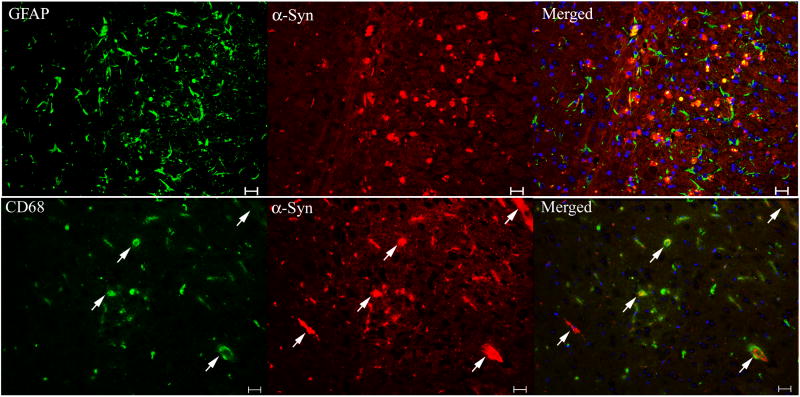
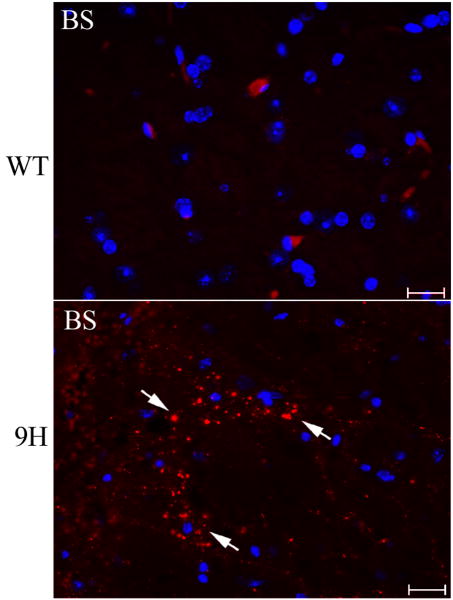
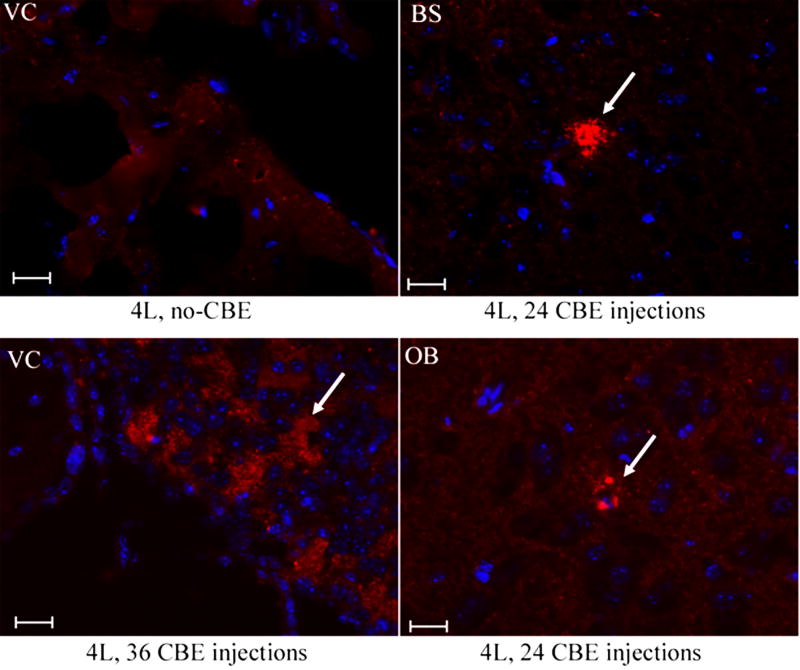
Gaucher disease, a prevalent lysosomal storage disease, is caused by insufficient activity of acid β-glucosidase (GCase) and resultant glucosylceramide accumulation. Recently in Parkinson disease (PD) patients, heterozygous mutations in GCase have been associated with earlier onset and more progressive PD. To understand the pathogenic relationships between GCase variants and Parkinsonism, α-synuclein and ubiquitin distributions and levels in the brains of several mouse models containing GCase variants were evaluated by immunohistochemistry. Progressive α-synuclein and ubiquitin aggregate accumulations were observed in the cortex, hippocampus, basal ganglia, brainstem, and some cerebellar regions between 4 and 24 weeks in mice that were homozygous for GCase [D409H (9H) or V394L (4L)] variants and also had a prosaposin hypomorphic (PS-NA) transgene. In 4L/PS-NA and 9H/PS-NA mice, this was coincident with progressive neurological manifestations and brain glucosylceramide accumulation. Ultrastructural studies showed electron dense inclusion bodies in neurons and axons of 9H/PS-NA brains. α-synuclein aggregates were also observed in ventricular, brainstem, and cerebellar regions of older mice (>42-weeks) with the GCase variant (D409H/D409H) without overt neurological disease. In a chemically induced GCase deficiency, α-synuclein aggregates and glucosylceramide accumulation also occurred. These studies demonstrate a relationship between glucosylceramide accumulation and α-synuclein aggregates, and implicate glucosylceramide accumulation as risk factor for the α-synucleinopathies.


Figures

Figure 1
Figure 1. Pathology in 9H/PS-NA brain
Brain sections were from 20-wk 9H/PS-NA mice. Upper panels: H&E staining sections showed (A) Normal neuron cells in WT and (B) axonal spheroids (arrows) suggesting degenerative neurons in cerebral cortex of 9H/PS-NA mice. Lower panels: Electron micrographs of neurons in 9H/PS-NA and WT deep cortical layer. (C) Neuron in heterozygote littermate. (D) Degenerating neurons in 9H/PS-NA mice showed irregular nuclear membranes with condensed chromatin (n), multiple mitochondria (m) and filament structures, and electronic dense particles (arrows) in the cytoplasm. (E) The axons in 9H/PS-NA brain showed accumulations of complex electron dense inclusion bodies (arrows) that were amorphous. The myelin sheaths of axons appeared normal in 9H/PS-NA mice. The scale bars are shown in each image. n=nuclei.
Figure 2
Figure 2. Glucosylceramide and glucosylsphingosine in the brain of disease mice
Cortex, cerebellum, hippocampus, and brainstem were dissected from 4L/PS-NA, 9H/PS-NA, PS-NA and WT mice for GSL analyses by LC/MS. (A) Glucosylceramide was 2 to 4-fold increased in cortex, cerebellum, hippocampus and brainstem of 9H/PS-NA and 4L/PS-NA mice, but only slightly increased in PS-NA mice. (B) Brain glucosylsphingosine was increased >10-20 fold in 4L/PS-NA, 3-5 fold in 4H/PS-NA, and unchanged in PS-NA.
Figure 3
Figure 3. Multiple α-synuclein aggregates in cortex and hippocampus of 9H/PS-NA brains
(A) Multiple α-synuclein particles (10-20 μm) in cortex. (B) Small dense α-synuclein particles (2-5 μm) within hippocampal CA3. (C and D) Corresponding brain sections from age-matched WT mice showing fine and low level α-synuclein signals. The size of α-synuclein aggregates were measured using an Apotome AxioV 200 microscope. Neuronal cell nuclei were stained with DAPI (blue). The scale bars are 20 μm.
Figure 4
Figure 4. α-Synuclein aggregates in brain
Brain sections from 12-wk WT, PS-NA, 4L/PS-NA, and 9H/PS-NA mice were processed for immunofluorescence analyses with anti α-synuclein antibody conjugated with Alexa-610 (red). Images were taken from cerebrum (Cr) and hippocampus (Hp) using the same exposure condition. Fine 1-2 μm α-synuclein particles were present in each genotype of mouse brain. α-Synuclein aggregates (≥ 5 μm) were only observed in the cerebrum of 12-wk 4L/PS-NA and 9H/PS-NA mice (arrows) or the hippocampus of 12-wk 9H/PS-NA mice (arrows). Such aggregates were not seen in WT brains. Neuronal cell nuclei were stained by DAPI (blue). The scale bars are 20 μm.
Figure 5
Figure 5. α-Synuclein oligomers in 4L/PS-NA and 9H/PS-NA brains
Immunoblots of WT, 4L/PS-NA, and 9H/PS-NA cerebral cortex (100 μg protein) from 18 wk mice (n=3) were developed with mouse-specific anti-α-synuclein monoclonal antibody (Top panel). α-Synuclein monomers were present in cortex from WT (lanes 1-2), 4L/PS-NA (lanes 3-5) and 9H/PS-NA (lanes 6-8), but two forms of α-synuclein oligomers were only in cortex from 4L/PS-NA (lane 3-5) and 9H/PS-NA (lane 6-8). Protein molecular weight markers (KD) are in the far right lane. The stripped and re-probed blot shows β-actin antibody as the loading control (bottom panel).
Figure 6
Figure 6. Coronal distribution of α-synuclein in the brain of 9H/PS-NA mice
Serial coronal brain sections of 10-wk 9H/PS-NA mice were photographed with a 4× objective under bright field before immunofluorescence staining processed. The brain sections were prepared from (A) Interaural 1.98 mm/Bregma -1.82 mm to (B) Interaural 0.40 mm/Bregma -3.40 mm including basal ganglia region and brainstem. Each figure is a hemisphere section composed by ∼20 images. After black/white photography, the sections were processed for immunofluorescence study using anti α-synuclein antibody. The regions containing α-synuclein positive aggregates were text-marked and the abbreviations are described in RESULTS.
Figure 7
Figure 7. Aggregated cytoplasmic proteins in the brain neurons from 9H/PS-NA mice
Serial brain sections from 23-wk 9H/PS-NA mice were processed for silver and α-synuclein and ubquitin immunofluorescence staining. Silver staining images show the presence of dense dark particles in cerebellar white matter of 9H/PS-NA mouse (A), but not in heterozygote littermate controls (D). The adjacent sections were processed for immunofluorescence staining using anti α-synuclein (Alexa-610, red) and anti ubiquitin (Alexa-488, green) antibodies. Arrows indicate the α-synuclein positive aggregates (B) or ubiquitin signals (C) in 9H/PS-NA sections. Yellow arrows indicate appositionally matched silver aggregates with both α-synuclein (B) and ubiquitin (C) Red arrows indicate the silver signals (A) that matched only with α-synuclein (B). The green arrow indicates that the silver signals in (A) matched only with ubiquitin signals (C). Brain tissues from heterozygote littermates were processed in parallel and no α-synuclein (E) or ubiquitin particles (F) were observed. The scale bars are 50 μm.
Figure 8
Figure 8. Age associated α-synuclein accumulation in brain of 9H/PS-NA mice
Brain sections from 10-, or 20-wk 9H/PS-NA mice were examined with anti-α-synuclein antibody. Various sized (5 to 32 μm) α-synuclein particles (Alex-610, red) were observed in olfactory bulb (OB), cerebellum (Cb), dentate gyrus (DG) and caudate putamen (CPu) regions as indicated. The size of some α-synuclein particles is increased from 10 to 20 wks as indicated in the figure. The images were taken using FITC filter as background (green). Neuron cell nuclei were stained by DAPI (blue). The scale bars are 20 μm.
Figure 9
Figure 9. Expression of α-synuclein and ubiquitin in the brain
Brain sections from 20-wk WT and 9H/PS-NA mice were examined with anti-ubiquitin (A and D, Alexa-488, green) and anti-α-synuclein (B and E, Alexa-610, red) antibodies as indicated. The panels show the midbrain region. Various sizes (5 – 17 μm) of ubiquitin and α-synuclein signals were seen only in 9H/PS-NA (D and E), and not in WT (A and B) brain. The ubiquitin signals were only partially co-localized with α-synuclein signals (arrow) in 9H/PS-NA (F) and not in WT (C). The scale bars are 20 μm.
Figure 10
Figure 10. The association of α-synuclein signals with astrocytes and microglial cells
Brain sections from 20-wk 9H/PS-NA mice were examined by dual antibody staining. (Upper panels) Cortical regions stained with monoclonal anti-mouse GFAP for astrocyte (Alexa-488, green)/polyclonal anti-mouse α-synuclein (Alexa-610, red). (Lower panels) Hippocampal CA2 regions stained with anti-CD68 for microglial cell (Alexa-488, green)/α-synuclein (Alexa-610, red). The GFAP signals did not colocalized with α-synuclein signals. α-Synuclein signals were not merged with CD68 signals, but some were within microglial cells (arrows). The scale bars are 20 μm. No significant α-synuclein, GFAP and CD68 signals were present in WT brain sections (not shown).
Figure 11
Figure 11. α-Synuclein staining in the brains of older mice
Serial brain sections from 42-wk WT (top) and 46-wk 9H (bottom) mice were examined with anti-α-synuclein antibody. Aggregated α-synuclein signals (Alexa-610, red) were detected in the brainstem (BS) regions of 9H mice (arrows). The corresponded sections from WT mice were processed in parallel (top). Some sporadic α-synuclein signals were observed in Cb, but not in BS of WT mice (data not shown). The scale bars were 20 μm (40×).
Figure 12
Figure 12. α-Synuclein in the brains of CBE-treated mice
Brain sections from 8-wk 4L mice that had 24 or 36 daily injections with 100 mg CBE/kg/day were examined with anti-α-synuclein antibody. Aggregated α-synuclein signals (Alexa-610, red) were detected in ventricle (VC, lower left panel), brainstem (BS, upper right panel) and olfactory bulb (OB, lower right panel) in the injected mice (arrows), but not in untreated (no-CBE) 4L mice (upper left panel). The scale bars were 20 μm (40×).

References

    1. Beutler E, Grabowski GA. Gaucher Disease. In: Scriver CR, Beaudet AL, Sly WS, Valle D, editors. The Metabolic and Molecular Basis of Inherited Disease. McGraw-Hill; New York: 2001. pp. 3635–3668.
    1. Grabowski GA, Saal HM, Wenstrup RJ, Barton NW. Gaucher disease: a prototype for molecular medicine. Crit Rev Oncol Hematol. 1996;23:25–55. - PubMed
    1. Sibille A, Eng CM, Kim SJ, Pastores G, Grabowski GA. Phenotype/genotype correlations in Gaucher disease type I: clinical and therapeutic implications. Am J Hum Genet. 1993;52:1094–1101. - PMC - PubMed
    1. Zimran A, Kay A, Gelbart T, Garver P, Thurston D, Saven A, Beutler E. Gaucher disease. Clinical, laboratory, radiologic, and genetic features of 53 patients. Medicine (Baltimore) 1992;71:337–353. - PubMed
    1. McKeran RO, Bradbury P, Taylor D, Stern G. Neurological involvement in type 1 (adult) Gaucher's disease. J Neurol Neurosurg Psychiatry. 1985;48:172–175. - PMC - PubMed

Publication types

MeSH terms