. 2011 Apr 1;286(13):11242-53.
doi: 10.1074/jbc.M110.171728. Epub 2011 Jan 21.

Synthesis, maturation, and trafficking of human Na+-dicarboxylate cotransporter NaDC1 requires the chaperone activity of cyclophilin B

Affiliations

Synthesis, maturation, and trafficking of human Na+-dicarboxylate cotransporter NaDC1 requires the chaperone activity of cyclophilin B

Marc J Bergeron et al. J Biol Chem. .

Abstract

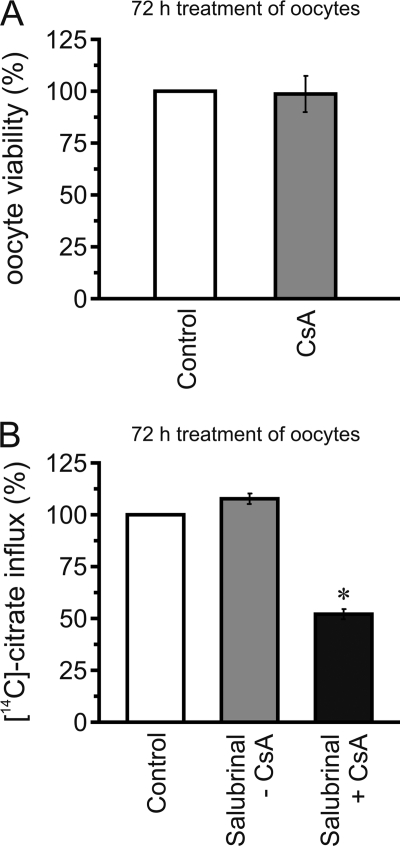
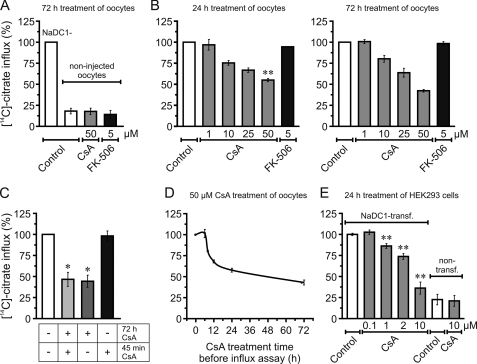
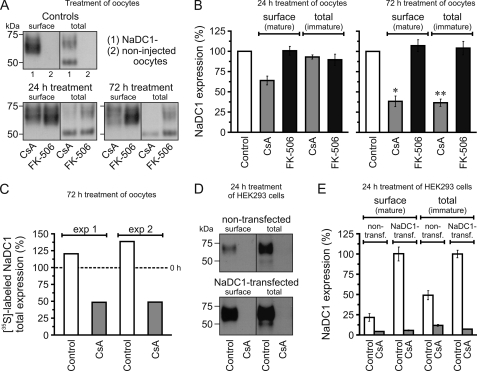
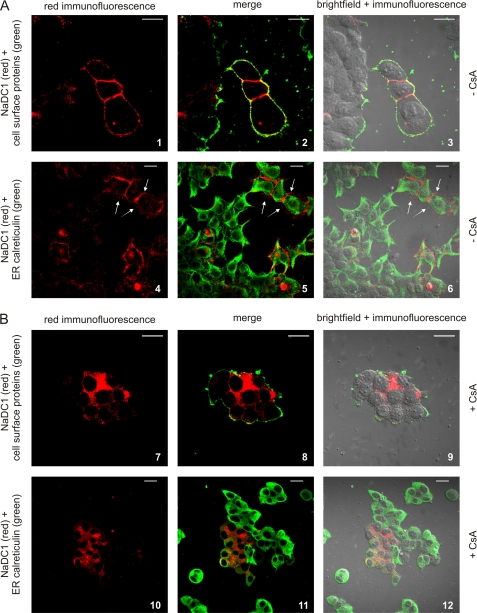
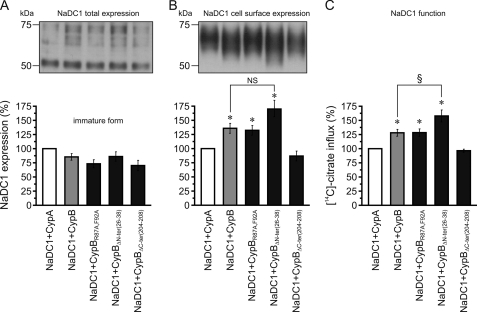
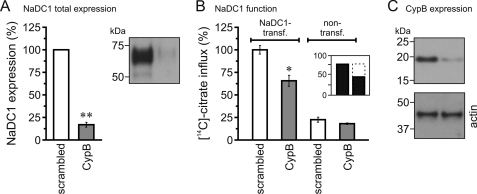
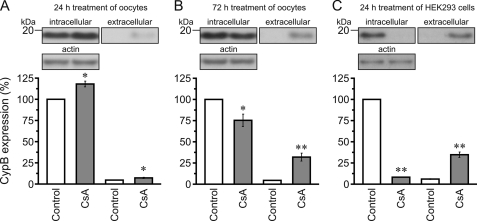
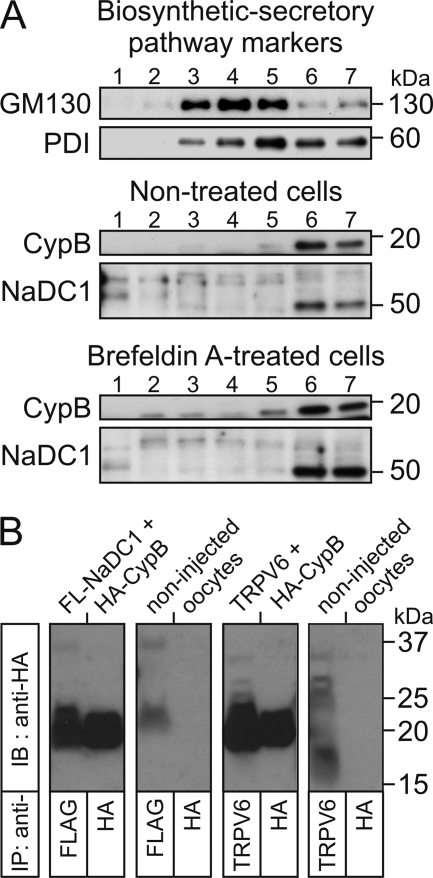
Renal excretion of citrate, an inhibitor of calcium stone formation, is controlled mainly by reabsorption via the apical Na(+)-dicarboxylate cotransporter NaDC1 (SLC13A2) in the proximal tubule. Recently, it has been shown that the protein phosphatase calcineurin inhibitors cyclosporin A (CsA) and FK-506 induce hypocitraturia, a risk factor for nephrolithiasis in kidney transplant patients, but apparently through urine acidification. This suggests that these agents up-regulate NaDC1 activity. Using the Xenopus lævis oocyte and HEK293 cell expression systems, we examined first the effect of both anti-calcineurins on NaDC1 activity and expression. While FK-506 had no effect, CsA reduced NaDC1-mediated citrate transport by lowering heterologous carrier expression (as well as endogenous carrier expression in HEK293 cells), indicating that calcineurin is not involved. Given that CsA also binds specifically to cyclophilins, we determined next whether such proteins could account for the observed changes by examining the effect of selected cyclophilin wild types and mutants on NaDC1 activity and cyclophilin-specific siRNA. Interestingly, our data show that the cyclophilin isoform B is likely responsible for down-regulation of carrier expression by CsA and that it does so via its chaperone activity on NaDC1 (by direct interaction) rather than its rotamase activity. We have thus identified for the first time a regulatory partner for NaDC1, and have gained novel mechanistic insight into the effect of CsA on renal citrate transport and kidney stone disease, as well as into the regulation of membrane transporters in general.


Figures

FIGURE 1.
FIGURE 1.
CsA and apoptosis mechanisms. A, treatment with 50 μm CsA did not affect the viability of NaDC1-expressing oocytes. B, treatment with 100 μm salubrinal had no effect on NaDC1 function and could not prevent inhibition of NaDC1 activity by 50 μm CsA (salubrinal+CsA). Data were normalized to values obtained with control treatment, expressed as %, and shown as averages (± S.E.) of 3–5 experiments. *, significant difference from control (p < 0.05).
FIGURE 2.
FIGURE 2.
Effect of CsA and FK-506 on NaDC1 function. A, NaDC1-injected oocytes exhibited 5-fold higher activity than non-injected oocytes. CsA and FK-506 had no effect on non-injected oocytes. B, CsA had a dose-dependent effect on NaDC1 function, with more than 1 μm CsA required to inhibit NaDC1 activity. FK-506 had no effect. C, treatment for 72 h with CsA reduced NaDC1 function independently of the presence or absence of CsA during 45-min uptakes. Presence of CsA only during 45-min uptakes had no effect. +, with CsA; −, without CsA. D, CsA also had a time-dependent effect on NaDC1 function. More than 6 h treatment was required to inhibit NaDC1 activity. E, CsA had a dose-dependent effect on NaDC1-transfected HEK293 cells citrate influx, with more than 0.1 μm CsA required to inhibit NaDC1 activity. CsA had no effect on non-transfected cell citrate influx. Data were normalized to values obtained with non-treated NaDC1-expressing oocytes or NaDC1-transfected cells, expressed as %, and shown as averages (± S.E.) of 3–11 experiments. In B, 24 h and 72 h treatments with 10, 25, and 50 μm CsA are statistically different from the respective control (p < 0.05). **, significant difference between 24 h and 72 h treatments with 50 μm CsA (p < 0.001). In C, *, significant difference from control (p < 0.05). In D, all averages are statistically different from control except that at 6 h (p < 0.05). In E, **, significant difference from NaDC1-transfected cell citrate influx control (p < 0.001).
FIGURE 3.
FIGURE 3.
Effect of CsA on NaDC1 expression. A and B, Western blot analysis: heterogeneously glycosylated NaDC1 forms have an apparent molecular mass ranging from ∼60 to ∼75 kDa, the immature NaDC1 form 50 kDa. Treatment with 50 μm CsA for 24 h and 72 h reduced cell surface expression of NaDC1, total expression (immature form) was only reduced by 72 h treatment. Treatment with 5 μm FK-506 had no effect. Data were normalized to control values and expressed as %. C, two metabolic labeling experiments with [35S]Met/Cys: 50 μm CsA treatment for 72 h reduced total newly synthesized NaDC1 proteins by ∼80%. Data were normalized to values obtained with the same treatment at 0 h and expressed as %. Dashed line: controls at 100%. D and E, Western blot analysis: 10 μm CsA treatment for 24 h almost completely abrogated cell surface and total NaDC1 expression in non- and NaDC1-transfected HEK293 cells. As with oocytes, only the 50 kDa band density was measured to determine total expression. Data were normalized to values obtained with non-treated NaDC1-transfected cells and expressed as %. In B and E, data are shown as averages (± S.E.) of 3–5 experiments. To average the total expression, data were first normalized to the actin values. In B, all treatments with CsA are statistically different from control (p < 0.05), except the 24 h treatment (total). * and **, significant difference between 24 h and 72 h treatments with CsA (p < 0.05 and 0.001, respectively). In E, all treatments with CsA are statistically different from control (p < 0.05).
FIGURE 4.
FIGURE 4.
Immunofluorescence studies in HEK293 cells. NaDC1-expressing HEK293 cells were not treated (A, −CsA) or treated with 10 μm CsA (B, +CsA) for 24 h. NaDC1 (red) was co-stained with the cell surface marker biotin (green; images 1–3 and 7–9) or the ER marker calreticulin (green; images 4–6 and 10–12). NaDC1 co-localized with biotin at the cell surface in non-treated cells (images 2, 3) but not after CsA treatment (images 8, 9). NaDC1 did not co-localize with calreticulin in non-treated cells (images 5, 6) or after CsA treatment (images 11, 12). Shown are representative 80× (no treatment) or 60× (CsA treatment) images. Scale bars: 20 μm.
FIGURE 5.
FIGURE 5.
Co-injection studies in oocytes. NaDC1 was injected with wt CypA (white bars), wt CypB (gray bars), or mutant CypB (black bars). CypB mutants: CypBR87A,F92A, enzymatically inactive; CypBΔN-ter(26–38), nuclear translocation signal depleted; CypBΔC-ter(204–208), ER retention sequence depleted. Western blot analysis: A, immature NaDC1 form expression remained unchanged in all co-injections. B, NaDC1 cell surface expression increased with CypB, CypBR87A,F92A, and CypBΔN-ter(26–38), compared with CypA and CypBΔC-ter(204–208). C, functional analysis showing perfect correlation between NaDC1 function and its cell surface expression. Data were normalized to values obtained with oocytes co-expressing NaDC1 and wt CypA, expressed as %, and shown as averages (± S.E.) of 4–11 experiments. To average the total expression, data were first normalized to the actin values. *, significant difference to NaDC1+CypA control (p < 0.05); NS, not statistically different between NaDC1+CypB and NaDC1+ CypBΔN-ter(26–38); §, significant difference between NaDC1+CypB and NaDC1+ CypBΔN-ter(26–38) (p < 0.05).
FIGURE 6.
FIGURE 6.
Effect of cyclophilin B knockdown on NaDC1 expression and function. A, knockdown reduced total NaDC1 expression in NaDC1-transfected HEK293 cells by ∼85%. B, knockdown reduced citrate influx of NaDC1-transfected cells only. Inset, recombinant NaDC1 activity (black bars) and its CypB knockdown-sensitive fraction (dashed part; 40%). C, Western blot analysis showing the efficacy of CypB knockdown in HEK293 cells. Knockdown reduced CypB expression by ∼65%. Gray bars: CypB knockdown. Data were normalized to values obtained with NaDC1- and scrambled siRNA-transfected cells, expressed as %, and shown as averages (± S.E.) of 3–11 experiments. *, and **, significant difference to NaDC1- and scrambled siRNA-transfected cells (p < 0.05 and 0.001, respectively).
FIGURE 7.
FIGURE 7.
Effect of CsA on cyclophilin B expression and secretion. Treatment of oocytes with 50 μm CsA for 24 h induced a weak up-regulation of CypB expression to compensate the weak secretion of CypB into the oocyte culture medium. Treatment of oocytes with 50 μm CsA for 72 h and HEK293 cells with 10 μm CsA for 24 h induced the secretion of CypB into the cell culture medium, thereby decreasing intracellular CypB availability. Data were normalized to values obtained with intracellular CypB in non-treated oocytes or HEK293 cells, expressed as %, and shown as averages (± S.E.) of 6–10 experiments. * and **, significant difference to intracellular or extracellular controls (p < 0.05 and 0.001, respectively).
FIGURE 8.
FIGURE 8.
Co-localization and co-immunoprecipitation of cyclophilin B with NaDC1. A, subcellular localization of CypB and NaDC1 in non-transfected HEK293 cells treated ± 200 ng/ml brefeldin A, Western analyses of the last seven fractions out of 10 (numbered 1–7), in which GM130 (cis-Golgi Matrix protein 130; cis-Golgi marker) and PDI (ER marker) were immunodetected. In non-treated cells, CypB co-localized with immature NaDC1 in the ER (fractions 6 and 7). In brefeldin A-treated cells, the expression of the immature NaDC1 form and CypB was increased in the ER (fractions 6 and 7). B, co-immunoprecipitation of CypB with NaDC1: HA-tagged CypB was co-injected with either FLAG-tagged NaDC1 or wt TRPV6 (positive control). Non-injected oocytes were used as negative control. NaDC1 and TRPV6 were immunoprecipitated (IP) with rabbit polyclonal anti-FLAG and chicken polyclonal anti-huTRPV6 antibodies, respectively. Western membranes were immunoblotted (IB) with the mouse monoclononal anti-HA. A CypB immunoreactive band (∼20 kDa) was detected in all co-immunoprecipitation studies.

References

    1. Hamm L. L. (1990) Kidney Int. 38, 728–735 - PubMed
    1. Hamm L. L., Hering-Smith K. S. (2002) Endocrinol. Metab. Clin. North Am. 31, 885–893 - PubMed
    1. He Y., Chen X., Yu Z., Wu D., Lv Y., Shi S., Zhu H. (2004) J. Nephrol. 17, 34–42 - PubMed
    1. Okamoto N., Aruga S., Matsuzaki S., Takahashi S., Matsushita K., Kitamura T. (2007) Int. J. Urol. 14, 344–349 - PubMed
    1. Ho H. T., Ko B. C., Cheung A. K., Lam A. K., Tam S., Chung S. K., Chung S. S. S. (2007) Kidney Int. 72, 63–71 - PubMed

Publication types

MeSH terms