. 2011 Mar 18;286(11):8909-16.
doi: 10.1074/jbc.M110.166819. Epub 2011 Jan 21.

Dual transport properties of anion exchanger 1: the same transmembrane segment is involved in anion exchange and in a cation leak

Affiliations

Dual transport properties of anion exchanger 1: the same transmembrane segment is involved in anion exchange and in a cation leak

Damien Barneaud-Rocca et al. J Biol Chem. .

Abstract

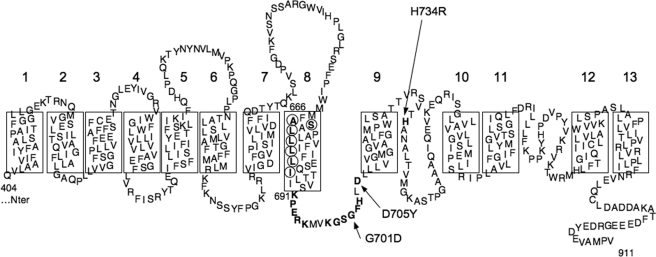
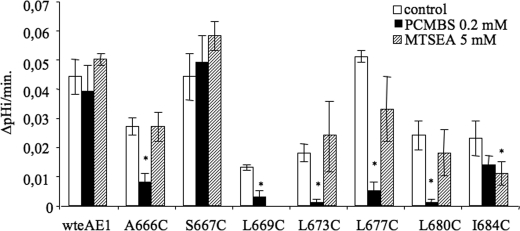
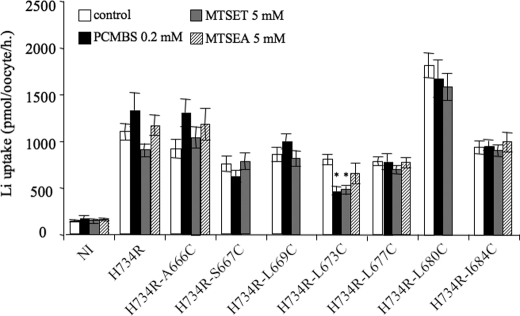
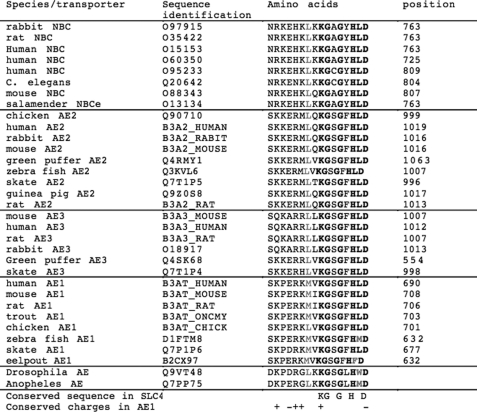
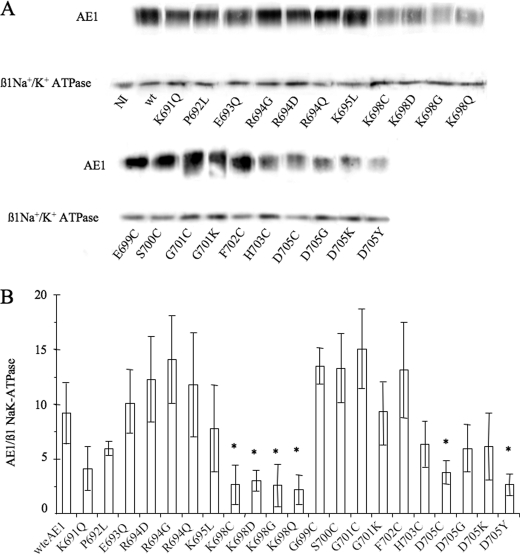
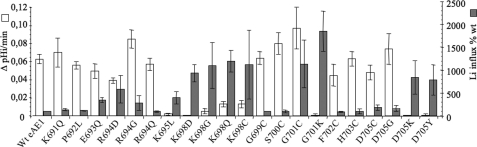
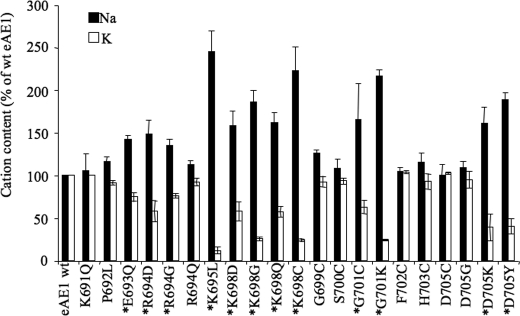
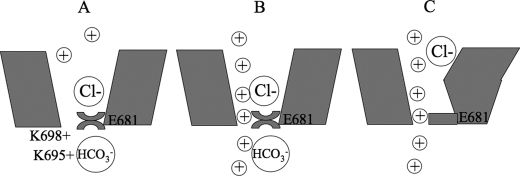
Previous results suggested that specific point mutations in human anion exchanger 1 (AE1) convert the electroneutral anion exchanger into a monovalent cation conductance. In the present study, the transport site for anion exchange and for the cation leak has been studied by cysteine scanning mutagenesis and sulfhydryl reagent chemistry. Moreover, the role of some highly conserved amino acids within members of the SLC4 family to which AE1 belongs has been assessed in AE1 transport properties. The results suggest that the same transport site within the AE1 spanning domain is involved in anion exchange or in cation transport. A functioning mechanism for this transport site is proposed according to transport properties of the different studied point mutations of AE1.


Figures

FIGURE 1.
FIGURE 1.
Putative topology of AE1-spanning domain according to Zhu et al. (26). The point mutations made in TM8 and in the intracellular loop between TM8 and TM9 are highlighted by bold characters. Arrows point out amino acid substitutions responsible for human pathologies and used in this study.
FIGURE 2.
FIGURE 2.
Cl/HCO3 exchange activity of WT AE1 and cysteine mutants. Oocytes were acidified by incubation in medium with 24 mm HCO3/5% CO2; at equilibrium extracellular chloride was substituted by gluconate, which should induce an alkalinization in presence of functional Cl/HCO3 exchange. The slope of the initial alkalinization as a function of time was calculated from intracellular pH recording of oocytes expressing WT or different cysteine mutants. The oocytes were in control condition (no treatment by alkylating agents, white bars) or treated by 0.2 mm PCMBS (black bars) or 5 mm MTSEA (striped bars). Thiol reagent treatments were done in MBS for 15 min, and then oocytes were washed in MBS before pHi measurements. Data presented are means ± S.E. (error bars) of 10 (wtAE1), 17 (A666C), 7 (S667C), 8 (L669C), 15 (L673C), 8 (L677C), 9 (L680C), and 11 (I684C) oocytes coming from two or three different batches. In supplemental Fig. 1 are presented traces of pHi recordings for oocytes expressing cysteine mutants with or without thiol reagents. For each mutant, Student's t test was performed to compare mean values in control condition or in presence of MTSEA or PCMBS. *, p < 0.05.
FIGURE 3.
FIGURE 3.
Li+ uptake in oocytes expressing WT AE1, H734R single mutant, or H734R mutation with introduced cysteine in TM8. Just before the uptake experiment, oocytes were incubated for 15 min in MBS with different thiolalkylating agents (PCMBS, black bars; MTSET, gray bars; MTSEA, striped bars). The uptake was done in LiNO3 medium with ouabain and bumetanide as mentioned under “Experimental Procedures.” Data presented are means ± S.E. (error bars) of 10–46 oocytes coming from 2–9 different experiments. *, p < 0.05 for each mutant a t test comparing control condition (without any reagent) with MTSET, PCMBS, or MTSEA conditions.
FIGURE 4.
FIGURE 4.
Alignment of conserved amino acids in the putative region between TM8 and TM9 (16 amino acids) in SLC4 family members. Identical amino acids are in bold characters, and conserved residues are in gray.
FIGURE 5.
FIGURE 5.
Immunodetection of WT and mutant AE1. A, Western blots for immunodetection of AE1 in biotin-labeled oocyte plasma membrane samples (upper row). Primary antibody was an anti-N-terminal domain of AE1 1/10,000 (CDB3, kind gift from Dr. P. Low). Lower row, immunodetection of β1 Na,K-ATPase (43 kDa) in the same samples (primary antibody clone M17-P5-F11, 1/250; Sigma). The figure combines three Western blots, showing all of the different AE1 constructs. The Western blots were chosen according to their similarity with the quantification data shown in Fig. 5B. B, quantification of AE1 level in plasma membrane normalized to β1 Na,K-ATPase signal. After corresponding background subtraction, pixels corresponding to AE1 signal were divided by pixels corresponding to β1 Na,K-ATPase signal in the same biotin-labeled sample. Each bar is a mean ± S.E. (error bars) of at least three different Western blots corresponding to different batches of injected oocytes. Student's t test was performed comparing WT AE1 data with mutant AE1 data (*, p < 0.07).
FIGURE 6.
FIGURE 6.
Cl/HCO3 exchange activity and Li+ uptake in oocytes expressing WT or mutated AE1. White bars, Cl/HCO3 exchange activity. The slope of initial alkalinization in gluconate-CO2/HCO3 medium was plotted as a function of time. Data are means ± S.E. (error bars) of 4–42 oocytes (depending on mutants) coming from at least two experiments. Gray bars, Li+ uptake. Data are means ± S.E. of at least three experiments (each of them with 7 oocytes/condition). To plot on a single figure data from different experiments with varying base line, in each experiment mean Li+ uptake for mutants was expressed as a percent of control oocytes (noninjected or expressing WT AE1). Mean ± S.E. Li+ uptake was in pmol/oocyte per h: 106 ± 99 (n = 34 experiments) for NI and 71 ± 64 (n = 28 experiments) for WT AE1. Statistical analyses of the data have been done with Student's t test comparing fluxes between WT and mutant-expressing oocytes.
FIGURE 7.
FIGURE 7.
Oocyte Na+ and K+ contents. Na+ and K+ contents of oocytes expressing WT or mutated AE1 are shown. Data are means ± S.E. (error bars) of at least three experiments. For each single experiment, measurements were done on triplicate for each condition and mean Na+ or K+ contents were expressed in percent of control oocytes (noninjected or expressing WT AE1). Student's t test was performed to compare data from mutant-expressing oocytes with WT-expressing oocytes (*, p < 0.07).
FIGURE 8.
FIGURE 8.
Proposed schematic view of AE1 transport conformations. A, anion exchange conformation. The two lysines in extracellular loop between TM8 and TM9 prevent cation leak. B, anion exchange with cation leak conformation. The two lysines moved away and exposed a pore for cation connecting both sides of the membrane; the anion exchange site is not impaired. C, cation leak conformation. Positive charges Lys-695 and Lys-698 moved away in cation leaky conformation, and anion exchange activity is turned down by funnel deformation, for instance.

Similar articles

Cited by

References

    1. Yool A. J., Weinstein A. M. (2002) News Physiol. Sci. 17, 68–72 - PubMed
    1. Ryan R. M., Vandenberg R. J. (2005) Clin. Exp. Pharmacol. Physiol. 32, 1–6 - PubMed
    1. DeFelice L. J., Goswami T. (2007) Annu. Rev. Physiol. 69, 87–112 - PubMed
    1. Larsson H. P., Picaud S. A., Werblin F. S., Lecar H. (1996) Biophys. J. 70, 733–742 - PMC - PubMed
    1. Vandenberg R. J., Huang S., Ryan R. M. (2008) Channels 2, 51–58 - PubMed