. 2011 Mar;43(3):197-203.
doi: 10.1038/ng.757. Epub 2011 Jan 23.

Mutations in lectin complement pathway genes COLEC11 and MASP1 cause 3MC syndrome

Affiliations

Mutations in lectin complement pathway genes COLEC11 and MASP1 cause 3MC syndrome

Caroline Rooryck et al. Nat Genet. 2011 Mar.

Abstract

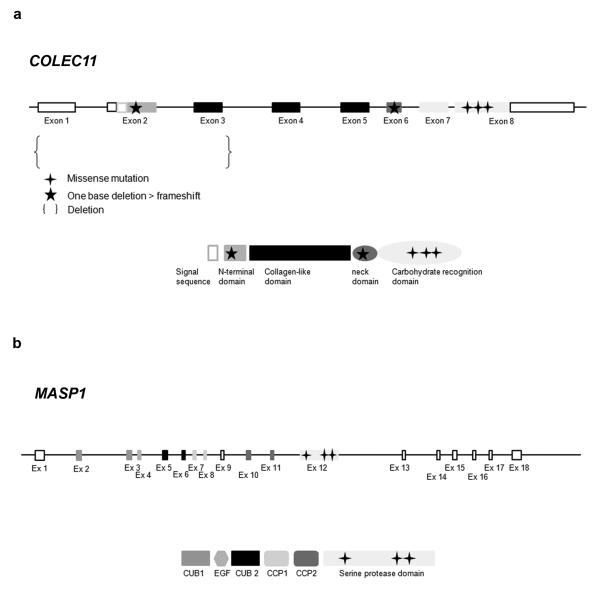
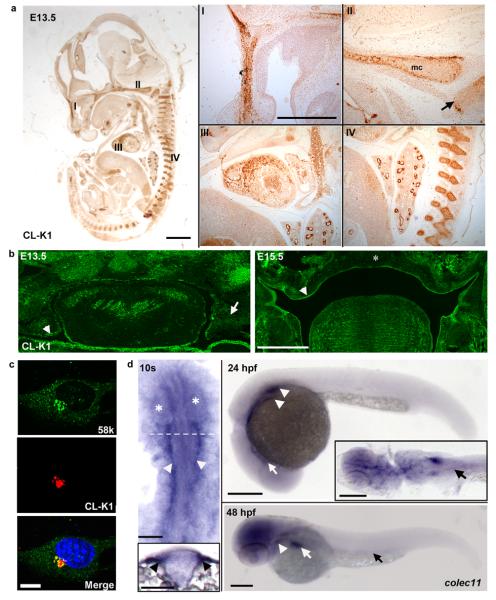
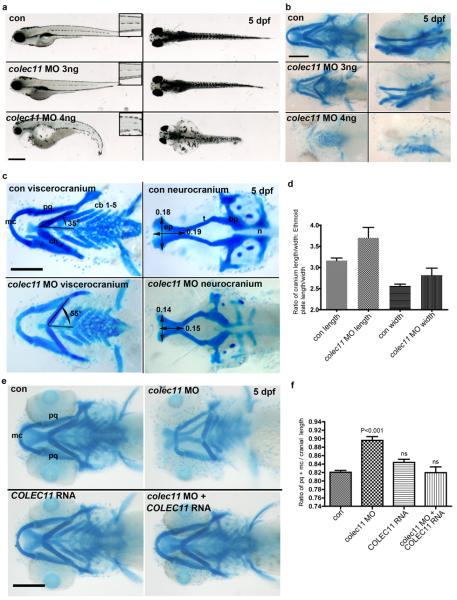
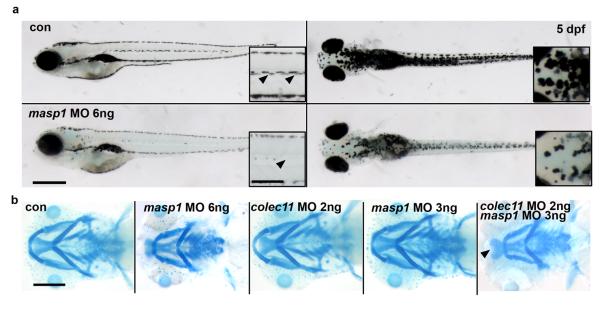
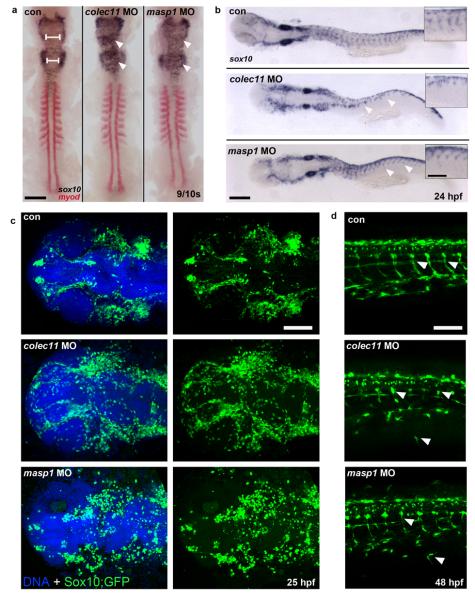
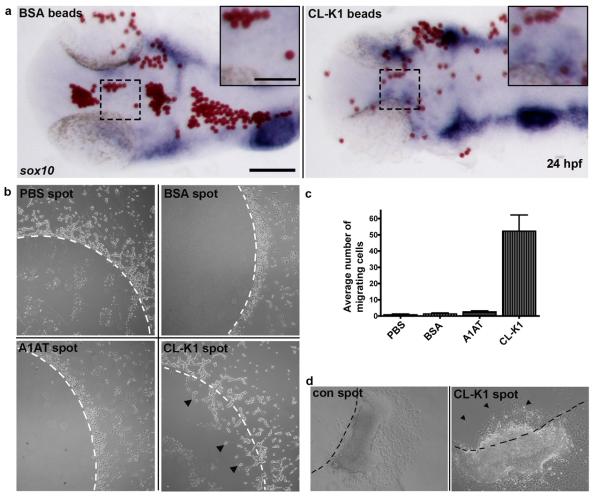
3MC syndrome has been proposed as a unifying term encompassing the overlapping Carnevale, Mingarelli, Malpuech and Michels syndromes. These rare autosomal recessive disorders exhibit a spectrum of developmental features, including characteristic facial dysmorphism, cleft lip and/or palate, craniosynostosis, learning disability and genital, limb and vesicorenal anomalies. Here we studied 11 families with 3MC syndrome and identified two mutated genes, COLEC11 and MASP1, both of which encode proteins in the lectin complement pathway (collectin kidney 1 (CL-K1) and MASP-1 and MASP-3, respectively). CL-K1 is highly expressed in embryonic murine craniofacial cartilage, heart, bronchi, kidney and vertebral bodies. Zebrafish morphants for either gene develop pigmentary defects and severe craniofacial abnormalities. Finally, we show that CL-K1 serves as a guidance cue for neural crest cell migration. Together, these findings demonstrate a role for complement pathway factors in fundamental developmental processes and in the etiology of 3MC syndrome.


Figures

Figure 1
Figure 1
Mutation summary. Location of the 5 different mutations identified in COLEC11 gene and protein. Location of the 3 different mutations identified in MASP1 gene and protein.
Figure 2
Figure 2
Immunolocalization of CL-K1 protein with polyclonal antibody a. in mouse embryo whole sections (scale bar: main panel 1 mm, inset panels 500 μm); CL-K1 (DAB) is expressed in the developing murine nasal septum (I), cartilage primordium of the basisphenoid bone (II, arrow), Meckel's cartilage (II, mc), myocardium (III), bronchioles and vertebrae (IV) at E13.5. b. CL-K1 is highly expressed in the palatal mesenchyme (arrow) and epithelium (arrow head) at E13.5. Later, at E15.5 CL-K1 is downregulated in the fused palatal shelf (asterisk) while expression is maintained in the palatal shelf epithelium (arrow head) (scale bar: 500 μm). c. ATDC5 cells showing immuno-colocalisation of endogenous CL-K1 and Golgi marker 58K (scale bar: 10 μm). d. colec11 in situ hybridisation at 10s, 24 hpf, and 48 hpf stages. At 10s, expression is localised to the cranial paraxial mesendoderm (arrow heads and transverse section, inset). The eyes are demarcated by asterisks and the relative position of the section marked by a dotted line. Scale bar: 100 μm. At 24hpf, transcripts are detected in the glomeruli (arrow heads) and cranial ventral midline (arrow). Inset shows a dorsal flatmount at 24 hpf highlighting expression in the glomeruli and pronephric ducts (PNDs, black arrow). At 48 hpf, colec11 remains in the glomeruli (arrow head), weakly in the PNDs (black arrow), and strongly in the liver (white arrow). Scale bar: 200 μm.
Figure 3
Figure 3
a. General morphology of colec11 zebrafish morphants at higher (4 ng) and lower (3 ng) doses of colec11 MO. Higher doses give rise to pronephric cysts, curved body axis, and cardiac oedema not present at 3 ng doses. A dose dependent loss of medial trunk pigmentation (insets – 1.5x magnification ) was observed (scale bar is 500 μm) b. Alcian blue cartilage staining in colec11 morphants (3 and 4 ng) at 5 dpf showing generalised cartilage defects (scale bar: 200 μm) c. Palate measurements in the colec11 morphants (3 ng) demonstrate shortening of length and width of the ethmoid plate, abnormal Meckel's cartilage (mc) and abnormal angulation of the ceratohyal cartilage (ch). Scale bar: 200 μm. d. Graph of ethmoid plate length and width measurements expressed as a ratio against cranial length and width, respectively, in the presence or absence of colec11 morpholino. There is clear evidence of significant morphological effects on both length and width, indicating shortening in both axes. (con length 3.164 ± 0.062 N=8, colec11 MO length 3.702 ± 0.245 N=8, con width 2.563 ± 0.0441 N=8, colec11 MO width 2.819 ± 0.168 N=8, each value indicates the mean ± SEM). e. Alcian blue cartilage staining of colec11 morphants rescued with human RNA COLEC11 (75 pg) compared to colec11 morphants (3ng), control uninjected and COLEC11 RNA injected alone embryos (scale bar: 200 μm). pq: palatoquadrate, mc: Meckel's cartilage. f. Graph showing the length ratio of both pq cartilages plus mc standardised over the cranial length. Con (0.821 ± 0.004, n=51), colec11 MO (0.896 ± 0.009, n=50), COLEC11 RNA (0.844 ± 0.007, n=21), colec11 MO plus COLEC11 RNA (0.820 ± 0.014, n=16). Values shown as mean ± SEM. Data was analysed by one way ANOVA with Tukey's Multiple Comparison Test comparing column data against control measurements. Morphants have a significantly shorter pq+mc length compared to uninjected controls (p<0.001), whilst no significant (ns) difference was observed in controls versus colec11MO plus COLEC11 RNA or versus COLEC11 RNA injected alone. Key angles and measures are indicated to illustrate cartilage defects. ep = ethmoid plate, t=trabeculae, n=notochord, bp=basal plate, pq=palatoquadrate, cb=ceratobranchials
Figure 4
Figure 4
a. General morphology of masp1 zebrafish morphants showing pigmentation defect (arrows; scale bar; main panel = 500 μm; inset = 200 μm) b. Alcian blue cartilage staining at 5 dpf showing cartilage defects in masp1 morphants (6 ng) (panel second from left). Alcian blue staining in morphants double-injected with suboptimal doses of colec11 (2 ng) and masp1 (3ng) MO (panel far right). We observed a cartilage defect only in double-injected morphants compared with single suboptimal injections of either colec11 or masp1 MO (panels third and fourth from left).
Figure 5
Figure 5
a. SOX10/MyoD in situ experiments on zebrafish colec11 and masp1 morphants showing an abnormal distribution of the CNCC in the hindbrain of 10 somite-stage embryos, with a massive expansion of cells across the midline compared to controls (left panel, white arrowheads). b. Streaming of NCCs into the head and through the somites (arrow heads) is also disrupted in colec11 and masp1 morphants at 24 hpf, as indicated by aberrant sox10 expression. (scale bar: main panels 200 μm, inset panels 100 μm) c. Expression of Sox10:eGFP (green) in the head at 24 hpf highlights disorganised NCCs in colec11 and masp1 morphants (scale bar: 100 μm). d. At 48 hpf, clearly defined tracks of Sox10:eGFP (white arrow heads) are detected migrating through tail somites of uninjected control embryos, however both colec11 and masp1 morphants show abnormal and ectopic migration of NCCs throughout the tail. Scale bar: 100 μm.
Figure 6
Figure 6
Cell migration assays. a. Zebrafish in vivo NCC chemo-attraction assay. Embryos were implanted with either BSA or CL-K1 coated micro beads (red) into the head of 18 somite stage embryos that were subsequently grown to 24 hpf. In situ hybridisation for sox10 (blue) reveals preferential migration of NCC towards beads coated with CL-K1 but not BSA (inset). Scale bars: main panels 100 μm, inset panels 50 μm. b. Recombinant protein assays: representative images of control agarose spots containing either PBS, BSA, alpha-1 antitrypsin (A1AT), or CL-K1. White dashed lines represent the border of the spot. No cells migrated under the control agarose spots. In contrast HeLa cells were attracted to the CL-K1 containing spot, clearly migrating through the agarose (black arrowheads). Scale bar: 200 μm. c. Chart showing the average number of cells moving across the agarose border in five independent experiments. d. Quail neural tube assay: CL-K1 and PBS control agarose spots were placed on coverslips to which explanted neural tubes were carefully laid adjacent to (but not touching) the spot. NCCs migrating away from the neural tubes actively invaded CL-K1- but not PBS-containing spots, of which there was little to no migration. Scale bar: 200 μm.

References

    1. Carnevale F, Krajewska G, Fischetto R, Greco MG, Bonvino A. Ptosis of eyelids, strabismus, diastasis recti, hip defect, cryptorchidism, and developmental delay in two sibs. Am J Med Genet. 1989;33:186–9. - PubMed
    1. Mingarelli R, Castriota Scanderbeg A, Dallapiccola B. Two sisters with a syndrome of ocular, skeletal, and abdominal abnormalities (OSA syndrome) J Med Genet. 1996;33:884–6. - PMC - PubMed
    1. Malpuech G, Demeocq F, Palcoux JB, Vanlieferinghen P. A previously undescribed autosomal recessive multiple congenital anomalies/mental retardation (MCA/MR) syndrome with growth failure, lip/palate cleft(s), and urogenital anomalies. Am J Med Genet. 1983;16:475–80. - PubMed
    1. Michels VV, Hittner HM, Beaudet AL. A clefting syndrome with ocular anterior chamber defect and lid anomalies. J Pediatr. 1978;93:444–6. - PubMed
    1. Al Kaissi A, et al. Asymmetrical skull, ptosis, hypertelorism, high nasal bridge, clefting, umbilical anomalies, and skeletal anomalies in sibs: is Carnevale syndrome a separate entity? Am J Med Genet A. 2007;143:349–54. - PubMed

Publication types

Substances