. 2011:2011:636951.
doi: 10.1155/2011/636951. Epub 2010 Dec 19.

Repetitive peroxide exposure reveals pleiotropic mitogen-activated protein kinase signaling mechanisms

Affiliations

Repetitive peroxide exposure reveals pleiotropic mitogen-activated protein kinase signaling mechanisms

Wayne Chadwick et al. J Signal Transduct. 2011.

Abstract

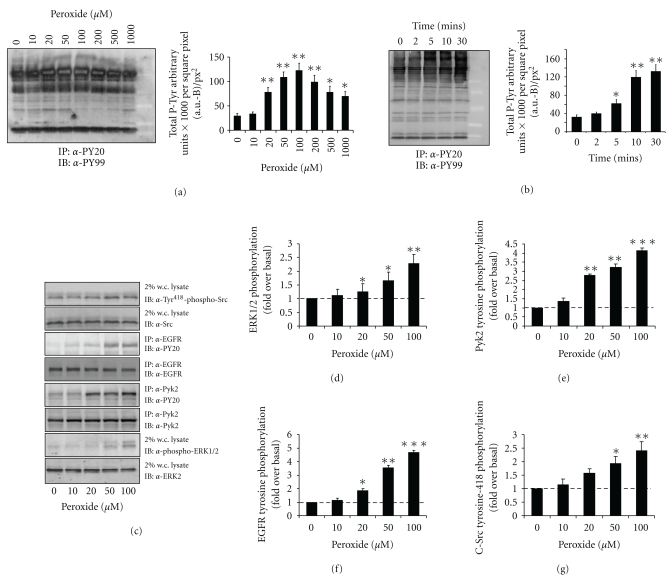
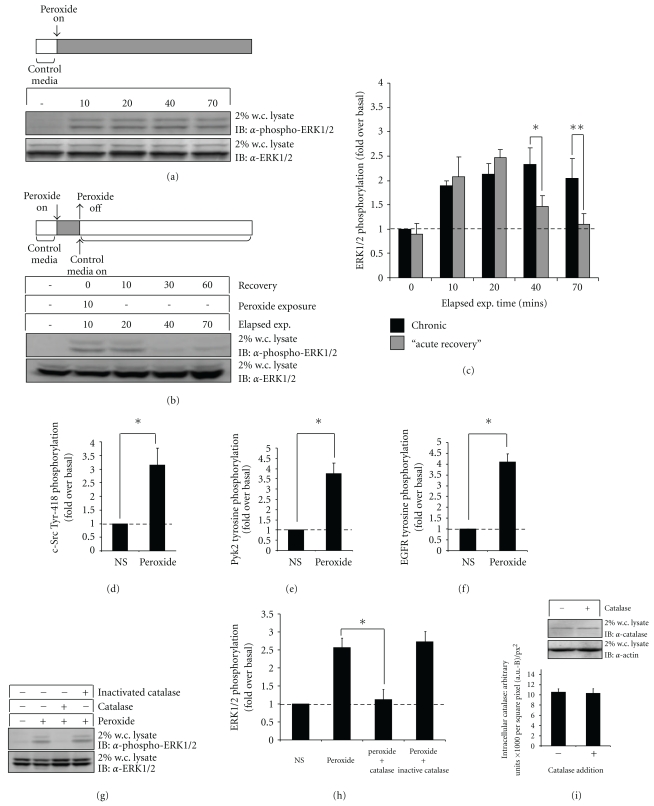
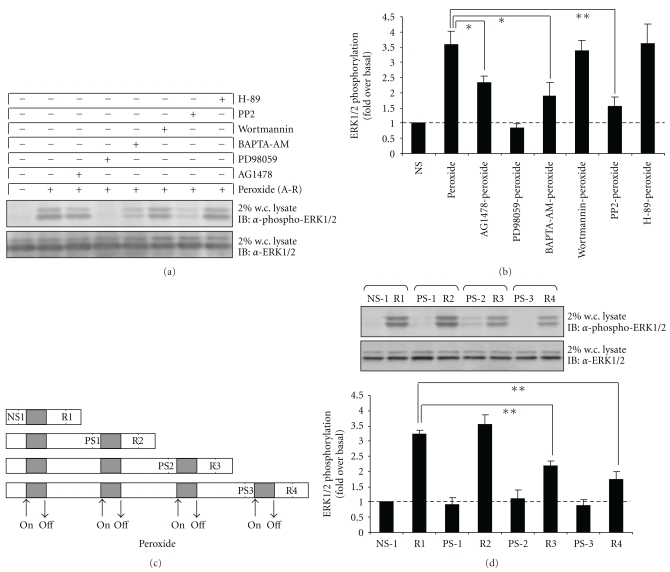
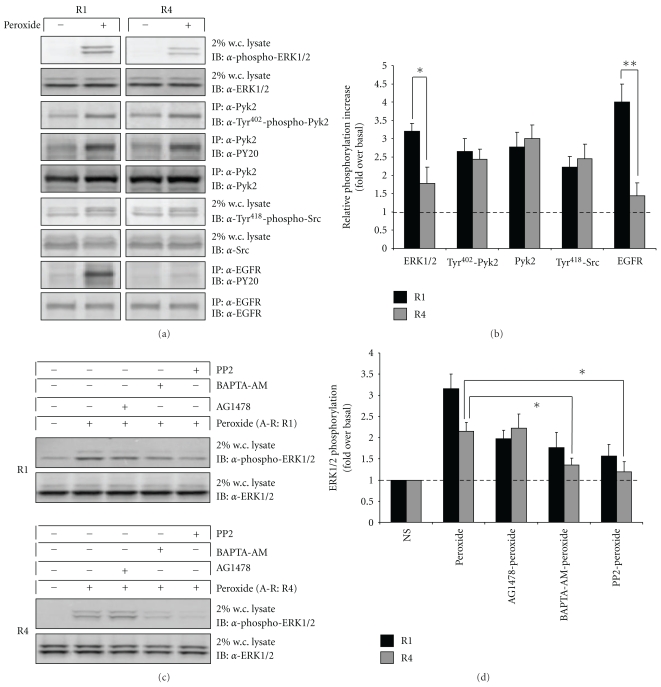
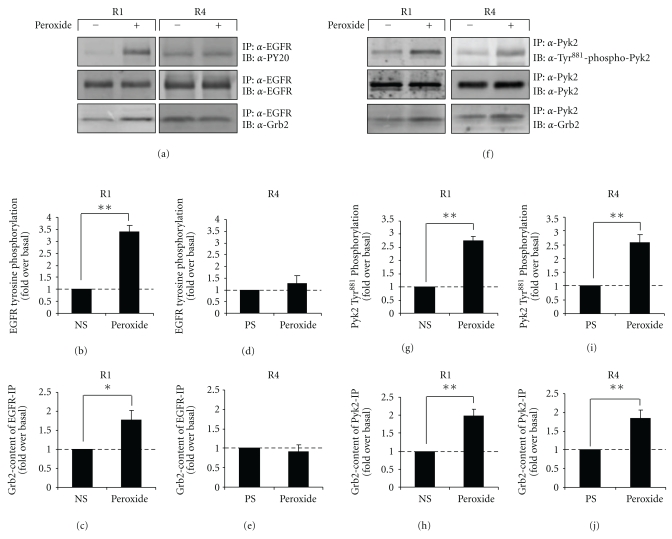
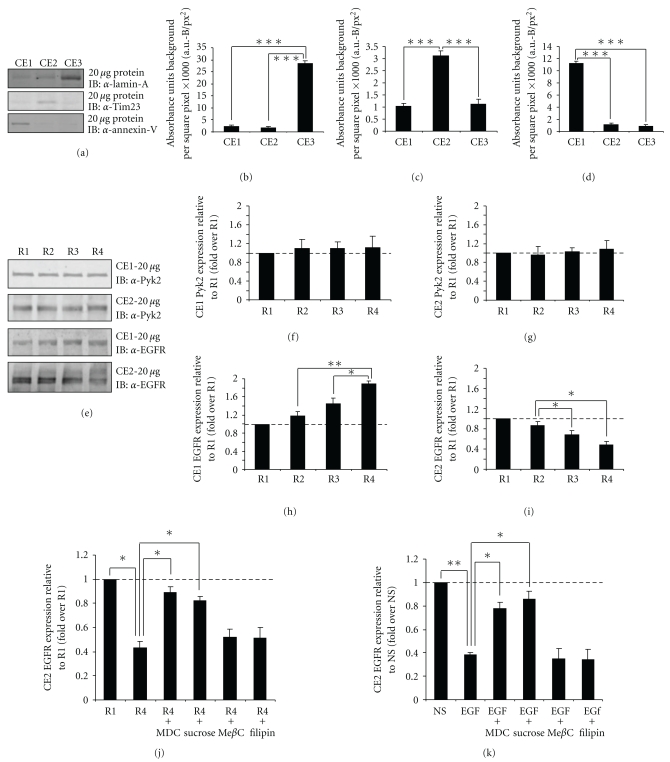
Oxidative stressors such as hydrogen peroxide control the activation of many interconnected signaling systems and are implicated in neurodegenerative disease etiology. Application of hydrogen peroxide to PC12 cells activated multiple tyrosine kinases (c-Src, epidermal growth factor receptor (EGFR), and Pyk2) and the serine-threonine kinase ERK1/2. Peroxide-induced ERK1/2 activation was sensitive to intracellular calcium chelation and EGFR and c-Src kinase inhibition. Acute application and removal of peroxide allowed ERK1/2 activity levels to rapidly subside to basal serum-deprived levels. Using this protocol, we demonstrated that ERK1/2 activation tachyphylaxis developed upon repeated peroxide exposures. This tachyphylaxis was independent of c-Src/Pyk2 tyrosine phosphorylation but was associated with a progressive reduction of peroxide-induced EGFR tyrosine phosphorylation, EGFR interaction with growth factor receptor binding protein 2, and a redistribution of EGFR from the plasma membrane to the cytoplasm. Our data indicates that components of peroxide-induced ERK1/2 cascades are differentially affected by repeated exposures, indicating that oxidative signaling may be contextually variable.


Figures

Figure 1
Figure 1
Hydrogen peroxide exposure generates increases in tyrosine phosphorylation status and activation of multiple signaling proteins in PC12 cells. (a) Hydrogen peroxide dose-dependent (10–1000 μM) increases in whole-cell protein tyrosine phosphorylation. Hydrogen peroxide exposure time was 10 minutes. Total tyrosine phosphoproteins were purified by immunoprecipitation (IP) from PC12 cells using anti-phosphotyrosine antisera (PY20). Immunoblotting (IB) detection of the phosphotyrosine was achieved with an antisera raised against a differential phosphotyrosine immunogen (PY99). The associated histogram depicts the whole-lane image tyrosine phosphoprotein density quantitation measured as AU-B/px2. (b) Time-dependent hydrogen peroxide (100 μM) increases in whole-cell protein tyrosine phosphorylation. The associated histogram depicts the whole-lane image tyrosine phosphoprotein density quantitation measured as AU-B/px2. (c) Hydrogen peroxide (10 minutes) exposure induces the activation of extracellular signal-regulated kinase (ERK1/2: detected in 2% of the total protein from a whole-cell (w.c.) lysate), tyrosine phosphorylation of Pyk2 and the epidermal growth factor receptor (EGFR) and activation of the non-receptor tyrosine kinase c-Src. (d), (e), (f), and (g) depict the peroxide-induced fold changes in phosphorylation of c-Src, EGFR, Pyk2, and ERK1/2, respectively. Values in each histogram depict the mean ± standard error for three individual experiments for each set of bars. For statistical analysis probability values indicated are *P < .05, **P < .01, and ***P < .001.
Figure 2
Figure 2
ERK1/2 responses to chronic or acute-recovery exposure to hydrogen peroxide. (a) Chronic hydrogen peroxide exposure (70-minutes, 100 μM) and ERK1/2 activation (white bar-no peroxide, grey bar-peroxide exposure). (b) Acute-recovery hydrogen peroxide exposure (100 μM) and ERK1/2 activation. (c) Chronic (black bars) versus acute-recovery (grey bars) peroxide exposure ERK1/2 activation profile. Acute-recovery peroxide exposure-induced activation of c-Src (d), Pyk2 (e) and EGFR (f) tyrosine phosphorylation. (g)-(h) Catalase (40 U/mL) (active or heat-inactivated) effects upon peroxide-induced (acute-recovery protocol) ERK1/2 activation. (i) Intracellular catalase levels following extracellular enzyme exposure.
Figure 3
Figure 3
Chemical sensitivity and tachyphylaxis of the ERK activation response to the “acute-recovery” paradigm of hydrogen peroxide exposure. (a) Representative western blot of the chemical sensitivity of the acute-recovery paradigm peroxide-induced ERK activation (10 minute peroxide exposure, 10 minute recovery). Signaling reagents were pre-incubated with the PC12 cells prior to the “acute-recovery” peroxide exposure as follows: AG1478, 100 nM, 30 minutes; PD98059, 20 μM, 60 minutes; BAPTA-AM, 50 μM, 30 minutes; wortmannin, 10 nM, 30 minutes; PP2, 5 μM, 30 minutes; H-89, 10 μM, 30 minutes. (b) Histogram depicting the relative effects of the chemical pre-exposures from panel A to the fold over basal-induced ERK1/2 activation induced by the acute-recovery peroxide protocol. Each histogram bar depicts the mean ± standard error. (c) Diagrammatic representation of peroxide exposure procedures employed to derive protein extracts for examination of repeated peroxide exposure (grey panels) effects upon ERK1/2 activation (NS1—non-stimulated control ERK1/2 sample, R1—sample from 10 minutes after 10 minute acute-recovery peroxide process, PS2-PS3—prior-stimulation control levels before specific repeated peroxide exposure sample, R2–R4—repeated peroxide exposure protein samples). (d) The ERK1/2 activation responses to the repeated acute-recovery peroxide exposure demonstrates tachyphylaxis. The acute-recovery R1 response (10 minute exposure, 10 minute recovery) was followed by a 30 minute recovery before the same acute-recovery process was repeated, generating the R2 response. R3 and R4 responses were created in a similar manner from cells previously stimulated with R1, R2 and then subsequent R3 and R4 acute-recovery exposures. The associated histogram represents the mean ± standard error for three individual ERK1/2 R1-R4 tachyphylaxis experiments. For statistical analysis probability values indicated are *P < .05, **P < .01.
Figure 4
Figure 4
Repeated peroxide exposure differentially affects tyrosine kinase responses in PC12 cells. (a) Comparison of levels of peroxide-induced ERK1/2 activation, Pyk2 generic tyrosine and tyrosine-402 phosphorylation, c-Src tyrosine-418 phosphorylation and EGFR tyrosine phosphorylation between R1 and R4 responses. (b) The histogram depicts the quantitation of mean ± standard error for three individual experiments for the data represented in panel (a). The represented fold changes in ERK1/2, Pyk2 Tyr-402, Pyk2 generic tyrosine phosphorylation, c-Src Tyr-418 and EGFR tyrosine phosphorylation were calculated relative to the non-stimulated phosphorylation value prior to either R1 (black bars) or R4 (grey bars). (c) Chemical sensitivity of R1 versus R4 ERK1/2 phosphorylation responses to acute-recovery peroxide exposure paradigms. Preincubation times and chemical concentrations for AG1478, BAPTA-AM and PP2 were as used before in Figure 3. (d) The histogram depicts the quantitation of the mean ± standard error for three individual experiments for the data represented in panel (c) (R1-black bars; R4-grey bars). For statistical analysis probability values indicated are *P < .05, **P < .01.
Figure 5
Figure 5
Grb2 association with EGFR or Pyk2 is differentially affected by repeated peroxide exposure. (a) Representative western blots of phosphotyrosine and Grb2 content of EGFR immunoprecipitates from cells stimulated to R1 or the R4 level with 100 μM hydrogen peroxide. (b) EGFR immunoprecipitate tyrosine phosphorylation status in response to R1 hydrogen peroxide exposure (NS—non-stimulated). (c) Peroxide-induced fold changes in the Grb2 content of EGFR immunoprecipitates at the R1 response point. (d) EGFR immunoprecipitate tyrosine phosphorylation status in response to R4 hydrogen peroxide exposure (PS—pre-stimulated basal level prior to R4). (e) Peroxide-induced fold changes in the Grb2 content of EGFR immunoprecipitates at the R4 response point. (f) Representative western blots of Pyk2 Tyrosine 881 phosphorylation and Grb2 content of Pyk2 immunoprecipitates from cells stimulated to R1 or the R4 level with 100 μM hydrogen peroxide. (g) Pyk2 immunoprecipitate tyrosine-881 phosphorylation status in response to R1 hydrogen peroxide exposure. (h) Peroxide-induced fold changes in the Grb2 content of Pyk2 immunoprecipitates at the R1 response point. (i) Pyk2 immunoprecipitate tyrosine-881 phosphorylation status in response to R4 hydrogen peroxide exposure. (j) Peroxide-induced fold changes in the Grb2 content of Pyk2 immunoprecipitates at the R4 response point. The histograms in each panel depict the quantitation of the mean ± standard error for three individual experiments. For statistical analysis *P < .05, **P < .01.
Figure 6
Figure 6
Peroxide-mediated subcellular relocalization of EGFR. (a) Subcellular fractionation verification (nuclear, lamin-A: CE3; plasma membrane, Tim23: CE2; cytosol, annexin-V: CE1) and quantitation ((b)-lamin-A, (c)-Tim23, (d)-annexin-V). (e) Peroxide effects (responses R1-R4) on Pyk2 and EGFR subcellular localization Relative expression profiles for Pyk2 (CE1-CE2 quantification (f)-(g)) and EGFR (CE1-CE2 quantification (h)-(i)). Chemical inhibitor-mediated alteration of R4 peroxide-mediated (j) or EGF (k) induced EGFR redistribution from CE2 fraction. EGF (10 ng/mL)-mediated redistribution was compared to non-stimulated (NS) cells.

References

    1. Bumgarner RE, Yeung KY. Methods for the inference of biological pathways and networks. Methods in Molecular Biology. 2009;541:225–245. - PubMed
    1. Maudsley S, Martin B, Luttrell LM. G protein-coupled receptor signaling complexity in neuronal tissue: implications for novel therapeutics. Current Alzheimer Research. 2007;4(1):3–19. - PubMed
    1. Martin B, Brenneman R, Golden E, et al. Growth factor signals in neural cells: coherent patterns of interaction control multiple levels of molecular and phenotypic responses. The Journal of Biological Chemistry. 2009;284(4):2493–2511. - PMC - PubMed
    1. Maudsley S, Martin B, Luttrell LM. The origins of diversity and specificity in G protein-coupled receptor signaling. Journal of Pharmacology and Experimental Therapeutics. 2005;314(2):485–494. - PMC - PubMed
    1. Hancock JT. The role of redox mechanisms in cell signalling. Molecular Biotechnology. 2009;43(2):162–166. - PubMed