. 2011 Sep;23(9):2387-99.
doi: 10.1162/jocn.2011.21615. Epub 2011 Jan 24.

The development of cortical sensitivity to visual word forms

Affiliations

The development of cortical sensitivity to visual word forms

Michal Ben-Shachar et al. J Cogn Neurosci. 2011 Sep.

Abstract

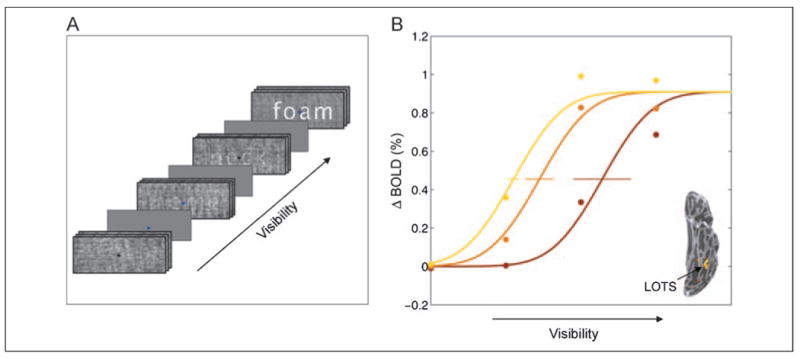
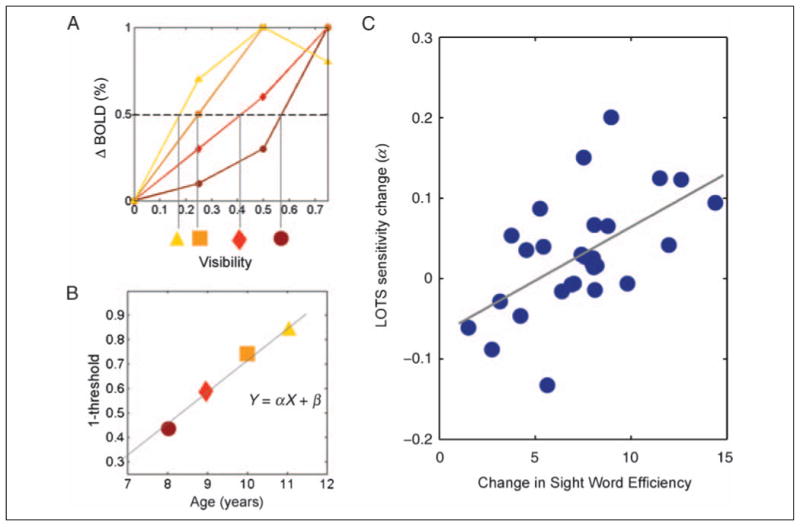
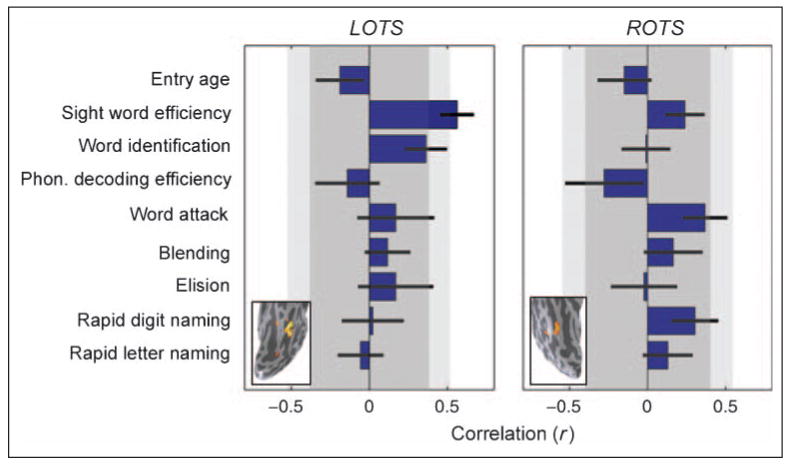
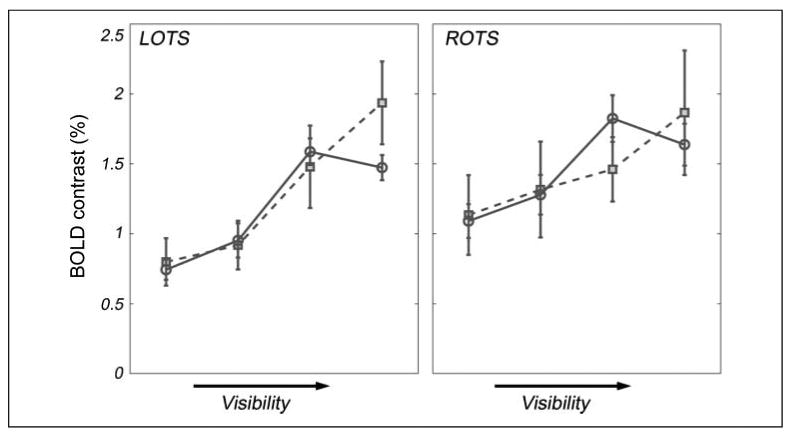
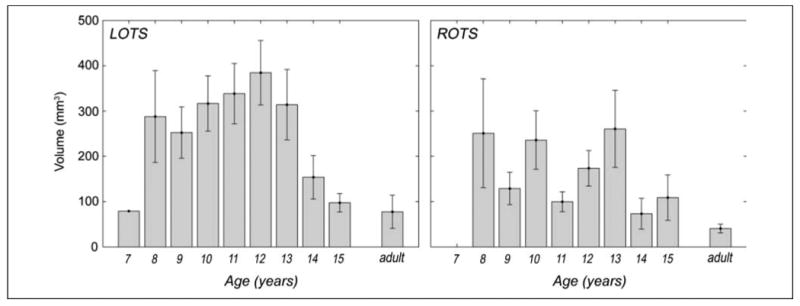
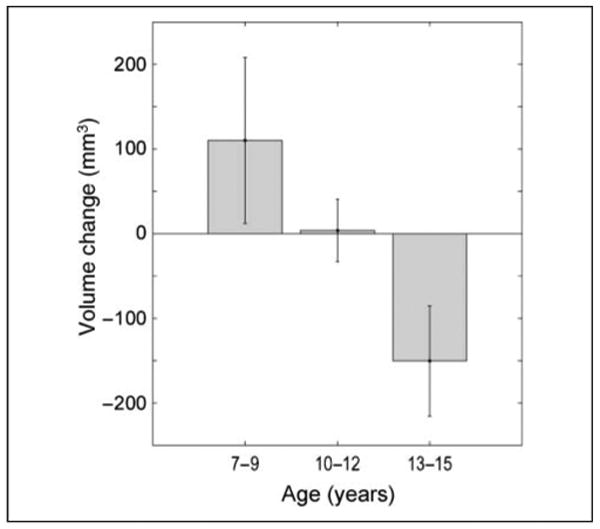
The ability to extract visual word forms quickly and efficiently is essential for using reading as a tool for learning. We describe the first longitudinal fMRI study to chart individual changes in cortical sensitivity to written words as reading develops. We conducted four annual measurements of brain function and reading skills in a heterogeneous group of children, initially 7-12 years old. The results show age-related increase in children's cortical sensitivity to word visibility in posterior left occipito-temporal sulcus (LOTS), nearby the anatomical location of the visual word form area. Moreover, the rate of increase in LOTS word sensitivity specifically correlates with the rate of improvement in sight word efficiency, a measure of speeded overt word reading. Other cortical regions, including V1, posterior parietal cortex, and the right homologue of LOTS, did not demonstrate such developmental changes. These results provide developmental support for the hypothesis that LOTS is part of the cortical circuitry that extracts visual word forms quickly and efficiently and highlight the importance of developing cortical sensitivity to word visibility in reading acquisition.


Figures

Figure 1
Figure 1
Experimental paradigm and age-grouped neurometric curves in LOTS. (A) Word visibility was controlled parametrically by varying the amount of phase scrambling applied to common four-letter English nouns. Stimuli were presented in blocks (six stimuli, 12 sec) in a pseudorandom order, interleaved with fixation blocks (12 sec, uniform gray rectangles). A black or dark blue fixation cross was refreshed every 2 sec throughout all blocks. Subjects indicated the color of the fixation cross using a response box. (B) Neurometric curves measured in the LOTS grouped by age: 7–8 years (brown), 9–11 years (orange), and 12–15 years (yellow). Mean change in contrast (ΔBOLD) is plotted as a function of visibility (inverse noise level). The ΔBOLD contrast is the difference between the fMRI responses for shape + noise and for noise alone. Circles represent the data, and separate curves were fitted to the data from each age group. The fitted curves were constrained to have the same upper asymptote and slope, differing only in horizontal position. Horizontal error bars represent the standard error, computed by bootstrapping.
Figure 2
Figure 2
Longitudinal change in LOTS predicted by the change in SWE. (A) Threshold visibility is the visibility level that gives rise to half the maximum fMRI response, and sensitivity is (1 – threshold). In this example, the threshold decreases (sensitivity increases) across four measurements (brown to yellow shapes). (B) Change in sensitivity is computed as the slope (α) of a line fit to the sensitivity measures over time. Similarly, behavioral change is computed as the slope of a line through the raw behavioral scores over time. Subjects with fewer than three usable data sets are excluded from this analysis. (C) The correlation between longitudinal change in LOTS sensitivity and SWE is highly significant (r = 0.564, SE = ±0.11; SE is computed by bootstrapping, n = 28).
Figure 3
Figure 3
Correlations between behavioral change and cortical sensitivity change. Horizontal bars represent correlations between the change in sensitivity in LOTS (left) or ROTS (right) and the change in several cognitive measures. Error bars are computed by bootstrapping. Dark gray areas denote uncorrected two-tailed significance range of p > .05; light gray areas denote Bonferroni corrected two-tailed significance range of p > .05. Only the correlation between LOTS change and SWE change is significant with Bonferroni (or FDR) correction for multiple comparisons. Word identification is close to significance, but none of the other correlations are significantly different from zero. Insets show the location of the cortical regions in a single data set (S8, f, at age 12). Mean (± SD) MNI coordinates of ROI across individuals: LOTS (n = 28), [−49, −65, −9] (± 5, 8, 5) and ROTS (n = 25), [46, −67, −12] (± 6, 7, 4).
Figure 4
Figure 4
OTS word visibility curves grouped by reading skill. Dashed lines with square symbols depict mean curves for poor readers (basic reading standardized score < 90, mean age = 10.85, n = 7 participants contributing 14 curves); full lines with circular symbols depict mean curves for good readers (basic reading standardized score ≥ 100, mean age = 10.76, n = 26 participants contributing 58 curves). Error bars are calculated as SEM, wherein n is the number of unique participants (which is more conservative than the number of observations).
Figure 5
Figure 5
OTS activation volume varies by age. Bars show mean cluster volume for the word visibility contrast (two most visible word conditions vs. two least visible word conditions) for each age group (n = 1, 6, 11, 21, 28, 25, 18, 6, 4, 9, respectively) in LOTS and ROTS. Adult cluster volume calculated on data from Ben-Shachar et al. (2007). Error bars represent SEM.
Figure 6
Figure 6
Longitudinal change in LOTS volume. Bars show mean year-to-year change in LOTS cluster volume, calculated as the difference (LOTS volume in year n) − (LOTS volume in year n − 1). Activation clusters captured as in Figure 5. Positive change indicates volume growth; negative change indicates volume decrease. Data are grouped by age, with 7- to 9-year-old children showing positive change (year-to-year increase in LOTS volume), 10- to 12-year-olds showing no change, and 13- to 15-year-olds showing negative change (year-to-year decrease in LOTS volume).

References

    1. Baker CI, Liu J, Wald LL, Kwong KK, Benner T, Kanwisher N. Visual word processing and experiential origins of functional selectivity in human extrastriate cortex. Proceedings of the National Academy of Sciences, USA. 2007;104:9087–9092. - PMC - PubMed
    1. Ben-Shachar M, Dougherty RF, Deutsch GK, Wandell BA. Contrast responsivity in MT+ correlates with phonological awareness and reading measures in children. Neuroimage. 2007a;37:1396–1406. - PMC - PubMed
    1. Ben-Shachar M, Dougherty RF, Deutsch GK, Wandell BA. Differential sensitivity to words and shapes in ventral occipito-temporal cortex. Cerebral Cortex. 2007b;17:1604–1611. - PubMed
    1. Ben-Shachar M, Dougherty RF, Wandell BA. White matter pathways in reading. Current Opinion in Neurobiology. 2007;17:258–270. - PubMed
    1. Binder JR, Medler DA, Westbury CF, Liebenthal E, Buchanan L. Tuning of the human left fusiform gyrus to sublexical orthographic structure. Neuroimage. 2006;33:739–748. - PMC - PubMed

Publication types

MeSH terms