Effect of zoledronic acid on bone healing subsequent to mini-implant insertion
- PMID: 21261489
- PMCID: PMC8923537
- DOI: 10.2319/070710-384.1
Effect of zoledronic acid on bone healing subsequent to mini-implant insertion
Abstract
Objective: To examine remodeling in bone supporting mini-implants by comparing a no drug (ND) group with a group that received a potent intravenous bisphosphonate in a canine model.
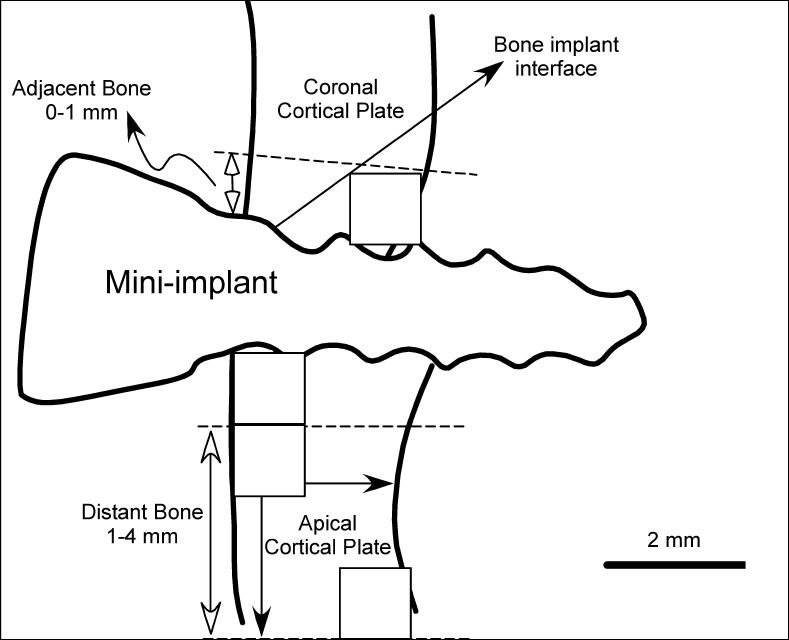
Materials and methods: Twelve skeletally mature (2- to 3-year-old) male dogs were divided into two groups. Seven dogs were administered 0.1 mg/kg/mo of zoledronic acid (ZA) for 16 weeks, while five age-matched dogs received no drug. Two mini-implants (Tomas, Dentaurum, Newton, Pa) were placed unilaterally in the maxilla and mandible (4 mini-implants per animal × 12 = 48). Serial fluorescent bone labels were administered in vivo. Postmortem, the bone blocks containing the mini-implants were harvested and used for histomorphometric analyses at two regions of interest (adjacent: within 1 mm of interface; distant: 1-4 mm from the interface) supporting the mini-implant. Data were analyzed using mixed models.
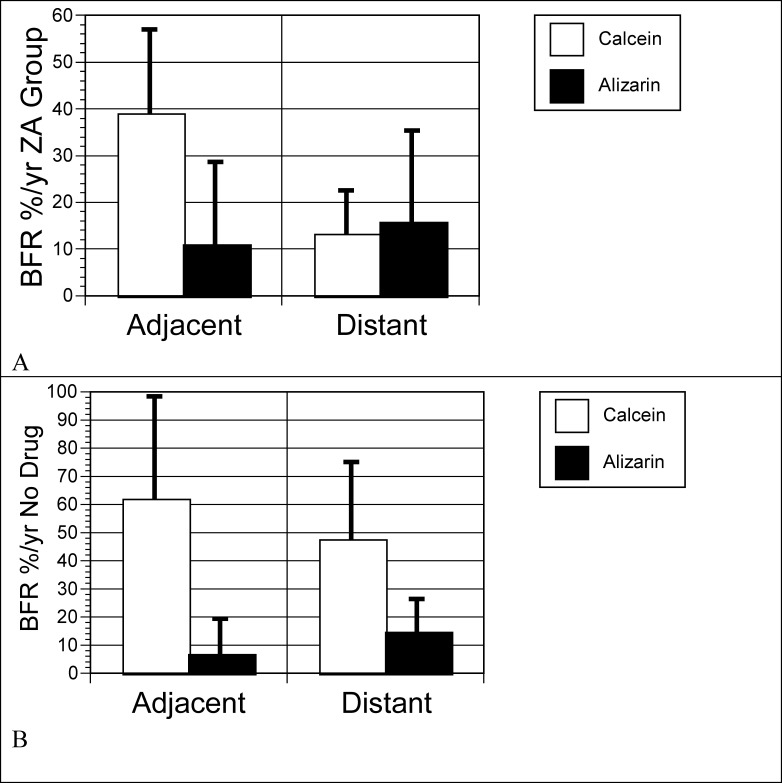
Results: In general, the ZA group had a significantly lower bone formation rate than the ND group (P < .05) for all jaws/regions except for the adjacent region in the maxilla, P = .12. Despite the reduction, mean intracortical remodeling in the ZA group ranged from 35%-42% per year in the implant adjacent bone. This rate is substantially higher than that reported for noninjured sites in the jaw.
Conclusions: Bone remodeling is typically elevated in implant supporting bone. After ZA administration, the healing response represented by elevated turnover in implant supporting bone was diminished but was not abolished.
Figures


Similar articles
-
Effects of short-term zoledronic acid treatment on bone remodeling and healing at surgical sites in the maxilla and mandible of aged dogs.J Oral Maxillofac Surg. 2011 Feb;69(2):418-27. doi: 10.1016/j.joms.2010.05.062. Epub 2010 Dec 3. J Oral Maxillofac Surg. 2011. PMID: 21122971
-
Early inhibitory effects of zoledronic acid in tooth extraction sockets in dogs are negated by recombinant human bone morphogenetic protein.J Oral Maxillofac Surg. 2014 Jan;72(1):61-6. doi: 10.1016/j.joms.2013.06.192. Epub 2013 Jul 25. J Oral Maxillofac Surg. 2014. PMID: 23891015
-
Cancer treatment dosing regimens of zoledronic acid result in near-complete suppression of mandible intracortical bone remodeling in beagle dogs.J Bone Miner Res. 2010 Jan;25(1):98-105. doi: 10.1359/jbmr.090713. J Bone Miner Res. 2010. PMID: 19580463 Free PMC article.
-
Zoledronic acid decreases bone formation without causing osteocyte death in mice.Arch Oral Biol. 2009 Sep;54(9):851-6. doi: 10.1016/j.archoralbio.2009.06.002. Epub 2009 Jul 9. Arch Oral Biol. 2009. PMID: 19591974
-
Efficacy of systemic bisphosphonate delivery on osseointegration of implants under osteoporotic conditions: lessons from animal studies.Arch Oral Biol. 2014 Sep;59(9):912-20. doi: 10.1016/j.archoralbio.2014.05.016. Epub 2014 May 16. Arch Oral Biol. 2014. PMID: 24908376 Review.
Cited by
-
Screw-type device diameter and orthodontic loading influence adjacent bone remodeling.Angle Orthod. 2017 May;87(3):466-472. doi: 10.2319/041316-302.1. Epub 2016 Dec 8. Angle Orthod. 2017. PMID: 27824255 Free PMC article.
References
-
- Bamias A, Kastritis E, Bamia C, et al. Osteonecrosis of the jaw in cancer after treatment with bisphosphonates: incidence and risk factors. J Clin Oncol. 2005;23:8580–8587. - PubMed
-
- Migliorati C. A, Siegel M. A, Elting L. S. Bisphosphonate-associated osteonecrosis: a long-term complication of bisphosphonate treatment. Lancet Oncol. 2006;7:508–514. - PubMed
-
- Vahtsevanos K, Kyrgidis A, Verrou E, et al. Longitudinal cohort study of risk factors in cancer patients of bisphosphonate-related osteonecrosis of the jaw. J Clin Oncol. 2009;27:5356–5362. - PubMed
-
- Madrid C, Sanz M. What impact do systemically administrated bisphosphonates have on oral implant therapy? A systematic review. Clin Oral Implants Res. 2009;20(suppl 4):87–95. - PubMed
-
- Zahrowski J. J. Bisphosphonate treatment: an orthodontic concern calling for a proactive approach. Am J Orthod Dentofacial Orthop. 2007;131:311–320. - PubMed
Publication types
MeSH terms
Substances
Grants and funding
LinkOut - more resources
Full Text Sources