. 2011 May-Jun;87(3):534-41.
doi: 10.1111/j.1751-1097.2011.00903.x. Epub 2011 Feb 22.

The primary photophysics of the Avena sativa phototropin 1 LOV2 domain observed with time-resolved emission spectroscopy

Affiliations

The primary photophysics of the Avena sativa phototropin 1 LOV2 domain observed with time-resolved emission spectroscopy

Ivo H M van Stokkum et al. Photochem Photobiol. 2011 May-Jun.

Abstract

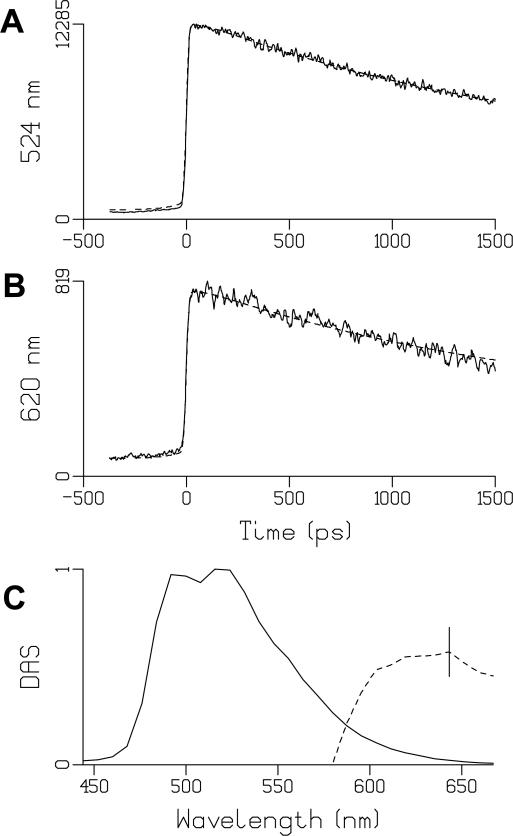
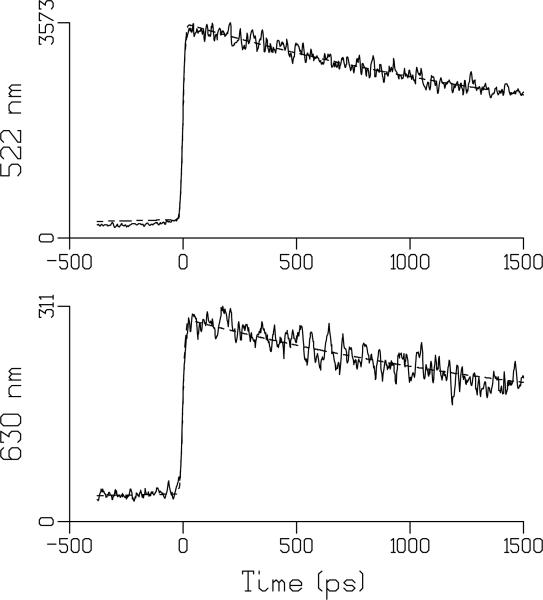
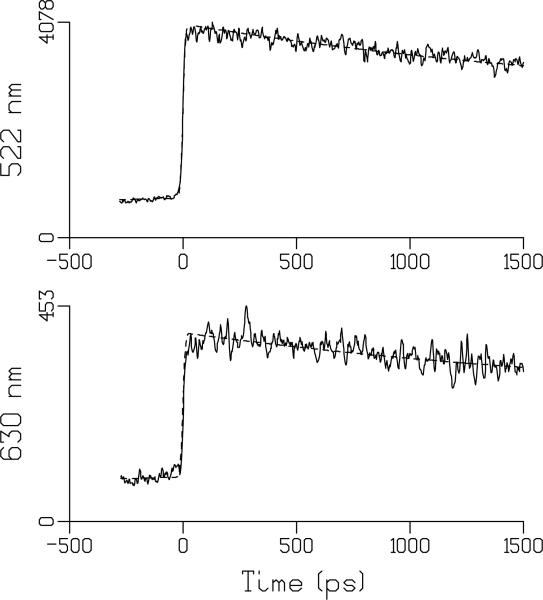
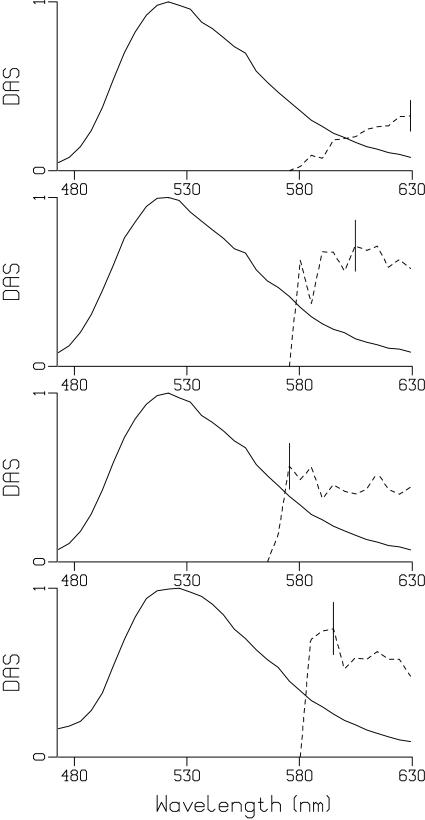
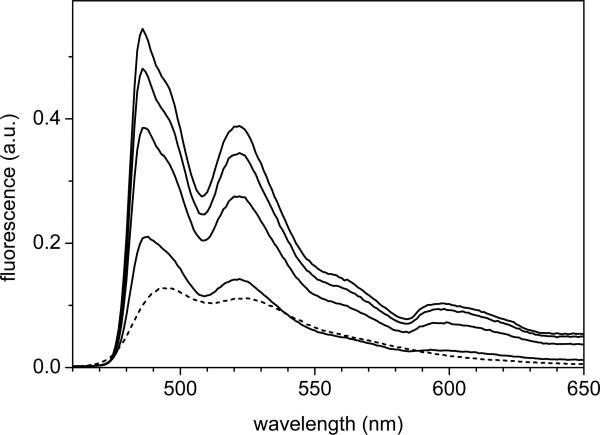
The phototropins are blue-light receptors that base their light-dependent action on the reversible formation of a covalent bond between a flavin mononucleotide (FMN) cofactor and a conserved cysteine in light, oxygen or voltage (LOV) domains. The primary reactions of the Avena sativa phototropin 1 LOV2 domain were investigated by means of time-resolved and low-temperature fluorescence spectroscopy. Synchroscan streak camera experiments revealed a fluorescence lifetime of 2.2 ns in LOV2. A weak long-lived component with emission intensity from 600 to 650 nm was assigned to phosphorescence from the reactive FMN triplet state. This observation allowed determination of the LOV2 triplet state energy level at physiological temperature at 16600 cm(-1). FMN dissolved in aqueous solution showed pH-dependent fluorescence lifetimes of 2.7 ns at pH 2 and 3.9-4.1 ns at pH 3-8. Here, too, a weak phosphorescence band was observed. The fluorescence quantum yield of LOV2 increased from 0.13 to 0.41 upon cooling the sample from 293 to 77 K. A pronounced phosphorescence emission around 600 nm was observed in the LOV2 domain between 77 and 120 K in the steady-state emission.


Figures

Fig. 1
Fig. 1
(A, B): Representative traces of LOV2 emission (solid) and their fits (dashed), at 524 nm (A) and 620 nm (B). Estimated lifetime was 2.2 ns. At 524 nm, the signal before time zero can be entirely attributed to the 2.2 ns decay in combination with the backsweep of the synchroscan streak camera system (59). At 620 nm, the relatively higher magnitude of the signal before time zero must be attributed to an additional long lived component. For this we used the 2 μs lifetime of the phosphorescence. During this very long lifetime the signal builds up from about a thousand forward and backward sweeps (the period of the synchroscan is 13 ns). See text for details. (C) Decay Associated Spectra (DAS) of LOV2. The solid line denotes the 2.2 ns DAS, the dashed line the 2 μs DAS. The dashed phosphorescence DAS has been multiplied by 5 × 10⁴. The vertical bar indicates the estimated standard error, which is negligible for the 2.2 ns DAS.
Fig. 2
Fig. 2
Representative traces of FMN emission at pH 2 (solid) and their fits (dashed) at 522 nm (top) and 630 nm (bottom). The estimated lifetime was 2.7 ns. At 522 nm, the signal before time zero can be entirely attributed to 2.7 ns decay in combination with the backsweep (after 6.5 ns) of the synchroscan streak camera system. At 630 nm, the relatively higher magnitude of the signal before time zero must be attributed to an additional long lived component and is assigned to phosphorescence. See text for details.
Fig. 3
Fig. 3
Representative traces of FMN emission at pH 8 (solid) and their fits (dashed) at 522 nm (top) and 630 nm (bottom). Estimated lifetime was 3.9 ns. At 522 nm, the signal before time zero can be entirely attributed to 3.9 ns decay in combination with the backsweep (after 6.5 ns) of the synchroscan streak camera system (59). At 630 nm, the relatively higher magnitude of the signal before time zero must be attributed to an additional long lived component and is assigned to phosphorescence. See text for details.
Fig. 4
Fig. 4
Decay Associated Spectra of FMN as a function of pH. From top to bottom pH 2, 3, 5, 8, with the solid lines denoting the 2.7, 3.9, 4.2 and 3.9 ns DAS (at pH 2,3,5,8, respectively), and the dashed lines denoting the10 μs DAS. The dashed phosphorescence DAS has been multiplied by 105. The vertical bar indicates the estimated standard error, which is negligible for the ≈4 ns DAS. The ordinate refers to the amplitude of the Decay-Associated Spectrum
Fig. 5
Fig. 5
Fluorescence emission spectra of the LOV2 domain of Avena sativa phototropin 1 at, from top to bottom, 77 K, 90 K, 120 K, 150 K and 293 K (dashed line). The excitation wavelength was 447 nm.

References

    1. Briggs WR, Tseng TS, Cho HY, Swartz TE, Sullivan S, Bogomolni RA, Kaiserli E, Christie JM. Journal of Integrative Plant Biology. 2007;49:4–10.
    1. Kami C, Lorrain S, Hornitschek P, Fankhauser C. Plant Development. Vol. 91. Elsevier Academic Press Inc; San Diego: LIGHT-REGULATED PLANT GROWTH AND DEVELOPMENT. pp. 29–66. - PubMed
    1. Moglich A, Yang XJ, Ayers RA, Moffat K. Structure and Function of Plant Photoreceptors. Annual Review of Plant Biology, Vol 61. 2010;61:21–47. - PubMed
    1. Christie JM, Salomon M, Nozue K, Wada M, Briggs WR. Proceedings of the National Academy of Sciences of the United States of America. 1999;96:8779–8783. - PMC - PubMed
    1. Salomon M, Christie JM, Knieb E, Lempert U, Briggs WR. Biochemistry. 2000;39:9401–9410. - PubMed

Publication types

LinkOut - more resources