

Bioremediation of marine oil spills: when and when not--the Exxon Valdez experience
- PMID: 21261915
- PMCID: PMC3815841
- DOI: 10.1111/j.1751-7915.2008.00079.x
Bioremediation of marine oil spills: when and when not--the Exxon Valdez experience
Abstract
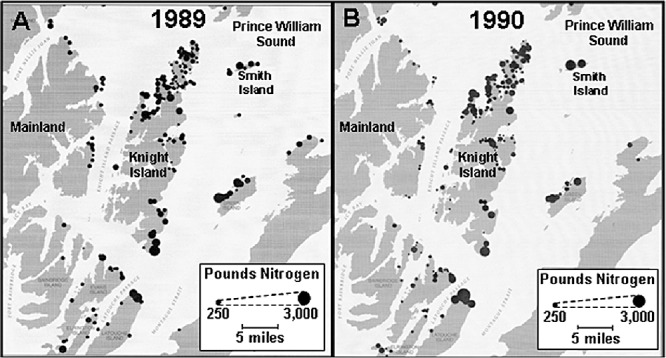
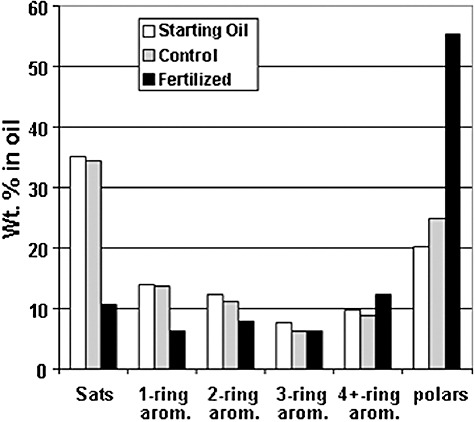
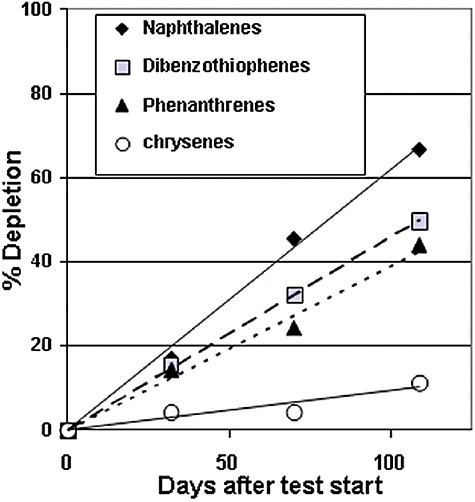
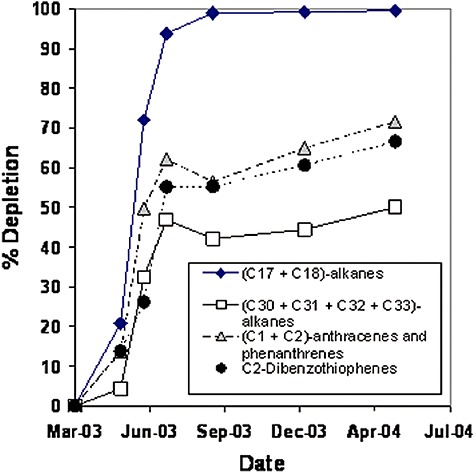
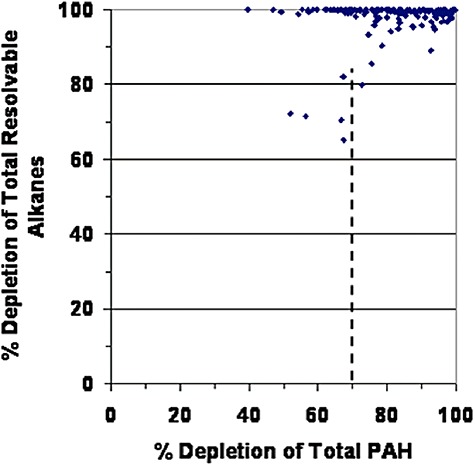
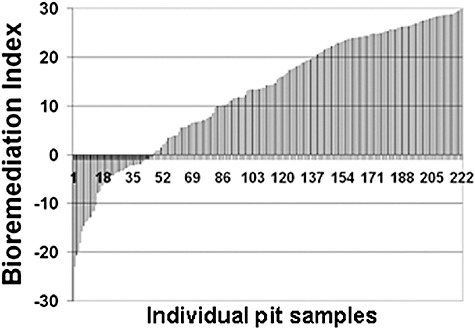
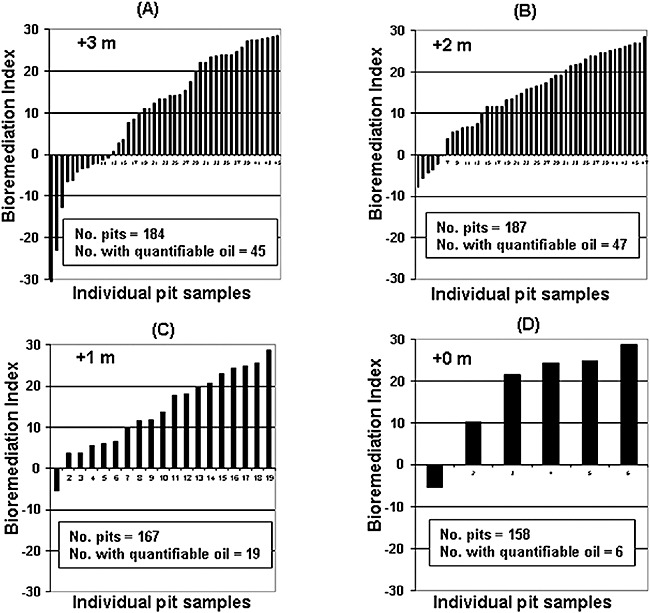
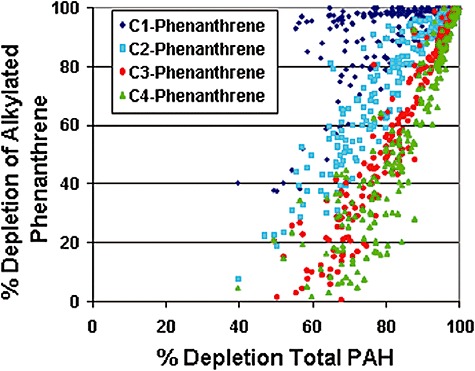
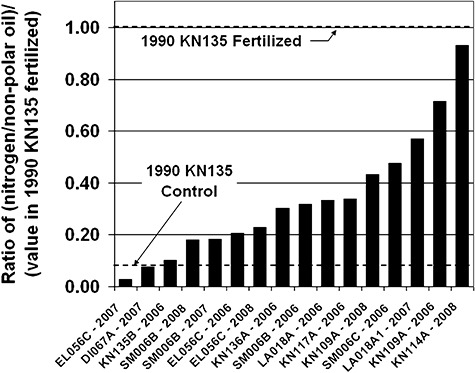
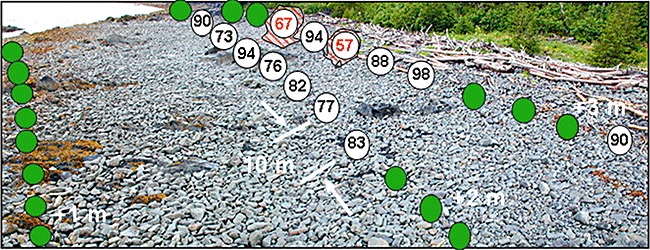
In this article we consider what we have learned from the Exxon Valdez oil spill (EVOS) in terms of when bioremediation should be considered and what it can accomplish. We present data on the state of oiling of Prince William Sound shorelines 18 years after the spill, including the concentration and composition of subsurface oil residues (SSOR) sampled by systematic shoreline surveys conducted between 2002 and 2007. Over this period, 346 sediment samples were analysed by GC-MS and extents of hydrocarbon depletion were quantified. In 2007 alone, 744 sediment samples were collected and extracted, and 222 were analysed. Most sediment samples from sites that were heavily oiled by the spill and physically cleaned and bioremediated between 1989 and 1991 show no remaining SSOR. Where SSOR does remain, it is for the most part highly weathered, with 82% of 2007 samples indicating depletion of total polycyclic aromatic hydrocarbon (Total PAH) of >70% relative to EVOS oil. This SSOR is sequestered in patchy deposits under boulder/cobble armour, generally in the mid-to-upper intertidal zone. The relatively high nutrient concentrations measured at these sites, the patchy distribution and the weathering state of the SSOR suggest that it is in a form and location where bioremediation likely would be ineffective at increasing the rate of hydrocarbon removal.
© 2009 The Authors. Journal compilation © 2009 Society for Applied Microbiology and Blackwell Publishing Ltd.
Figures
References
-
- Atlas R.M. Stimulated petroleum biodegradation. Crit Rev Microbiol. 1977;6:371–386. - PubMed
-
- Atlas R.M. Petroleum biodegradation and oil spill bioremediation. Marine Pollut Bullet. 1995;31:178–182.
-
- Atlas R.M., Bartha R. Biodegradation and mineralization of petroleum in seawater: limitation by nitrogen and phosphorus. Biotechnol Bioeng. 1972;14:309–318. - PubMed
-
- Atlas R.M., Bartha R. Stimulated biodegradation of oil slicks using hydrophobic fertilizers. Environ Sci Technol. 1973;7:538–541. - PubMed
-
- Atlas R.M., Bragg J.R. Assessing the long‐term weathering of petroleum on shorelines; uses of conserved components for calibrating loss and bioremediation potential. Proceedings of the Thirtieth Arctic and Marine Oilspill Program (AMOP) Technical Seminar. 2007;1:263–289.
Publication types
MeSH terms
Substances
LinkOut - more resources
Full Text Sources
Miscellaneous
