

Variation in the gut microbiota of laboratory mice is related to both genetic and environmental factors
- PMID: 21262117
- PMCID: PMC2958200
Variation in the gut microbiota of laboratory mice is related to both genetic and environmental factors
Abstract
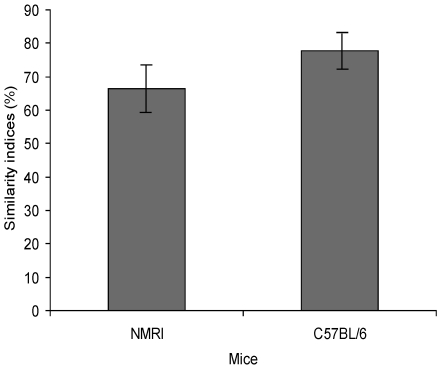
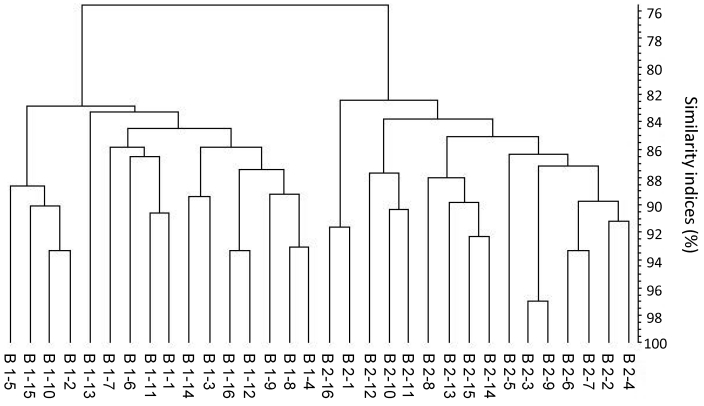
During recent years, the composition of the gut microbiota (GM) has received increasing attention as a factor in the development of experimental inflammatory disease in animal models. Because increased variation in the GM might lead to increased variation in disease parameters, determining and reducing GM variation between laboratory animals may provide more consistent models. Both genetic and environmental aspects influence the composition of the GM and may vary between laboratory animal breeding centers and within an individual breeding center. This study investigated the variation in cecal microbiota in 8-wk-old NMRI and C57BL/6 mice by using denaturing gradient gel electrophoresis to profile PCR-derived amplicons from bacterial 16S rRNA genes. Comparison of the cecal microbiotas revealed that the similarity index of the inbred C57BL/6Sca strain was 10% higher than that of the outbred Sca:NMRI stock. Comparing C57BL/6 mice from 2 vendors revealed significant differences in the microbial profile, whereas the profiles of C57BL/6Sca mice raised in separate rooms within the same breeding center were not significantly different. Furthermore, housing in individually ventilated cages did not lead to intercage variation. These results show that denaturing gradient gel electrophoresis is a simple tool that can be used to characterize the gut microbiota of mice. Including such characterizations in future quality-control programs may increase the reproducibility of mouse studies.
Figures
References
-
- Bernbom N, Nørrung B, Saadbye P, Mølbak L, Vogensen FK, Licht TR. 2006. Comparison of methods and animal models commonly used for investigation of fecal microbiota: effects of time, host, and gender. J Microbiol Methods 66:87–95 - PubMed
-
- Cani PD, Possemiers S, Van de Wiele T, Guiot Y, Everard A, Rottier O, Geurts L, Naslain D, Neyrinck A, Lambert DM, Muccioli GG, Delzenne NM. 2009. Changes in gut microbiota control inflammation in obese mice through a mechanism involving GLP2-driven improvement of gut permeability. Gut 58:1091–1103 - PMC - PubMed
-
- Council of the European Communities Council Directive 86/609/EEC of 24 November 1986 on the approximation of laws, regulations and administrative provisions of the Member States regarding the protection of animals used for experimental and other scientific purposes. Off J Eur Communities L358:1–28
-
- Ejsing-Duun M, Josephsen J, Aasted B, Buschard K, Hansen AK. 2008. Dietary gluten reduces the number of intestinal regulatory T cells in mice. Scand J Immunol 67:553–559 - PubMed
-
- Fasoli S, Marzotto M, Rizzotti L, Rossi F, Dellaglio F, Torriani S. 2003. Bacterial composition of commercial probiotic products as evaluated by PCR-DGGE analysis. Int J Food Microbiol 82:59–70 - PubMed
Publication types
MeSH terms
LinkOut - more resources
Full Text Sources