. 2011 Apr 15;352(2):215-27.
doi: 10.1016/j.ydbio.2011.01.010. Epub 2011 Jan 22.

Birthdating studies reshape models for pituitary gland cell specification

Affiliations

Birthdating studies reshape models for pituitary gland cell specification

Shannon W Davis et al. Dev Biol. .

Abstract

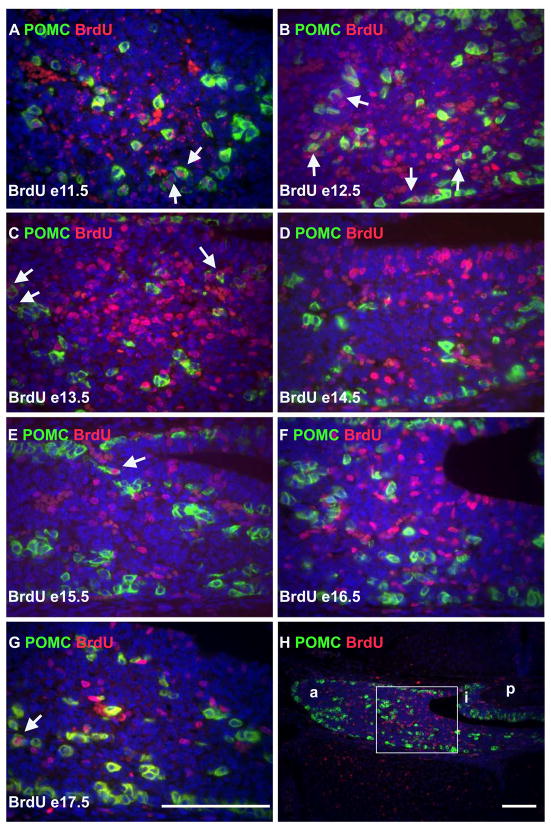
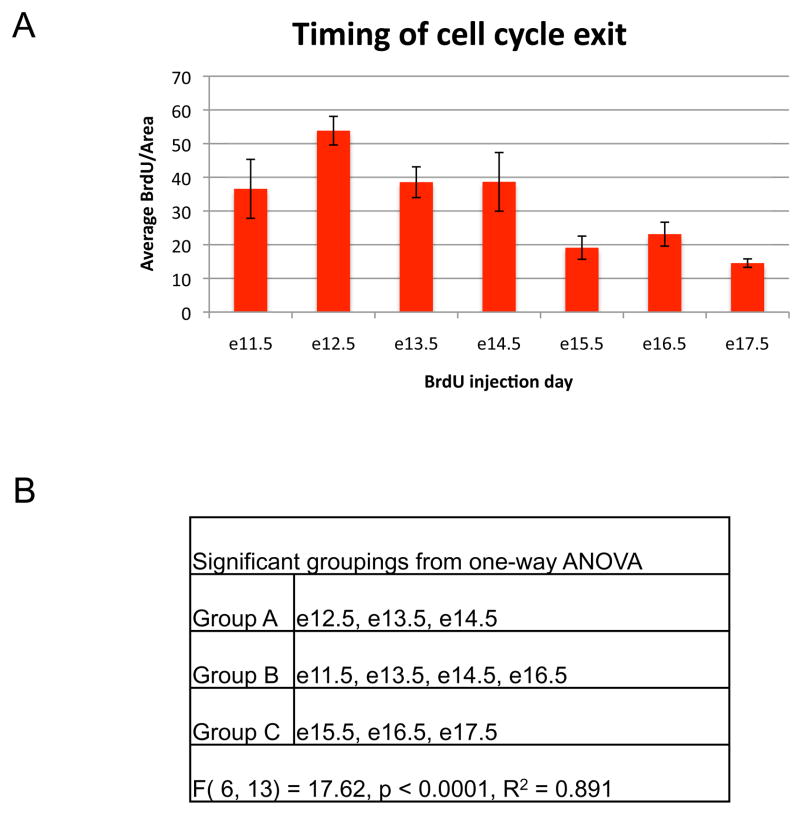
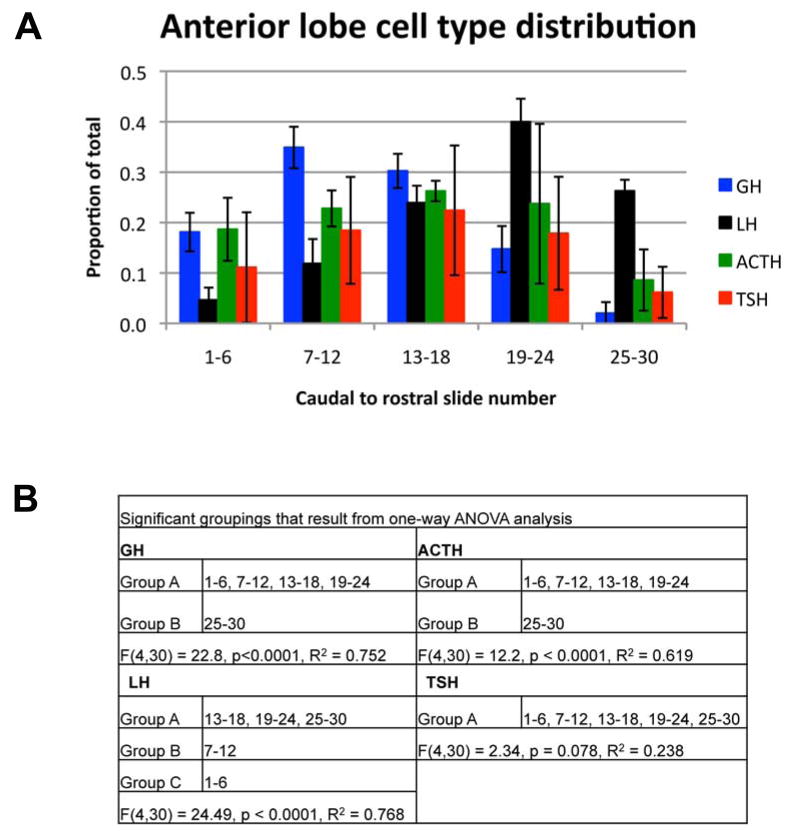
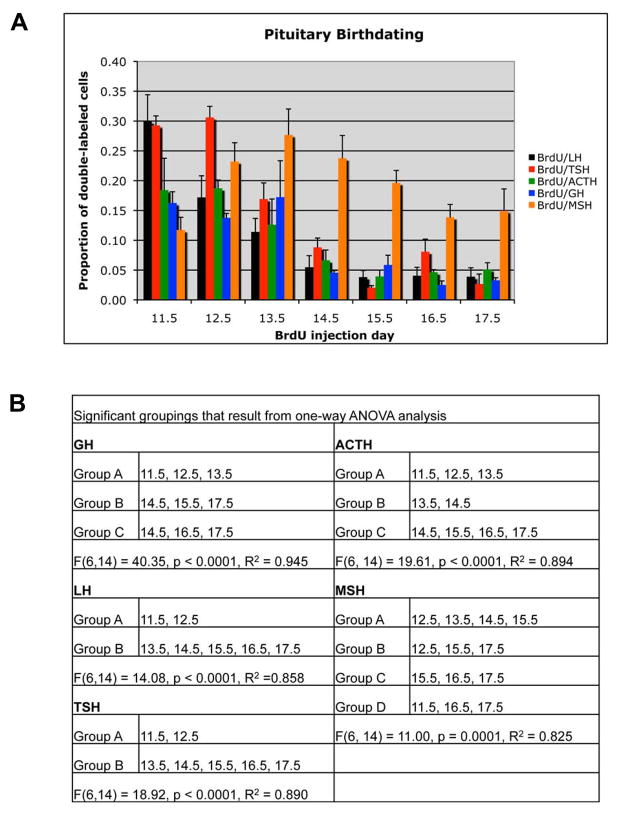
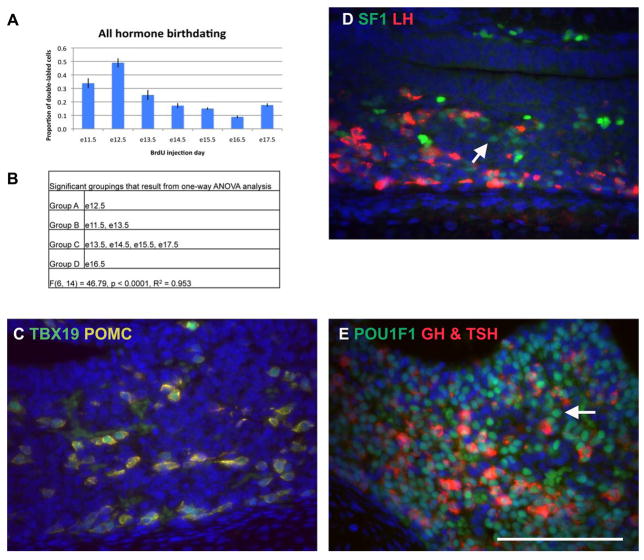
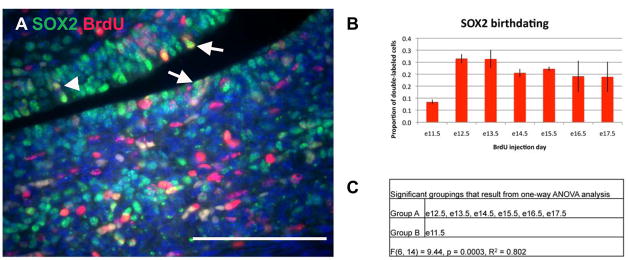
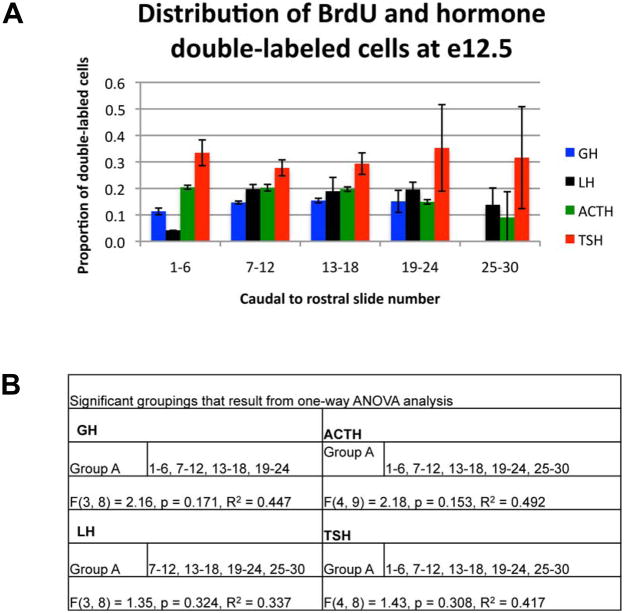
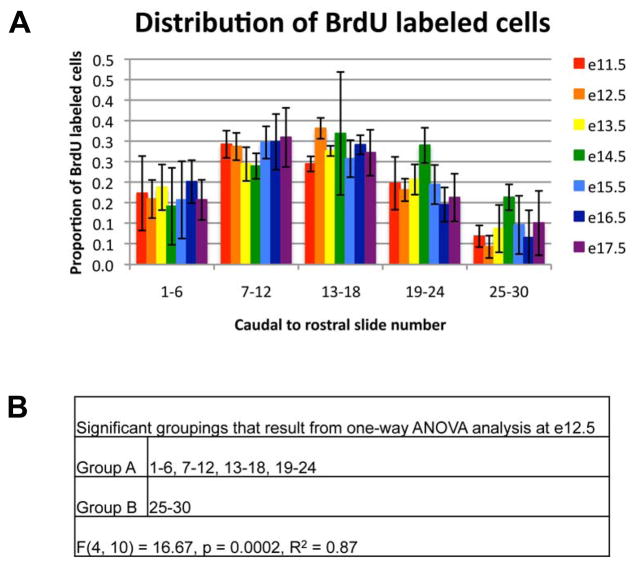
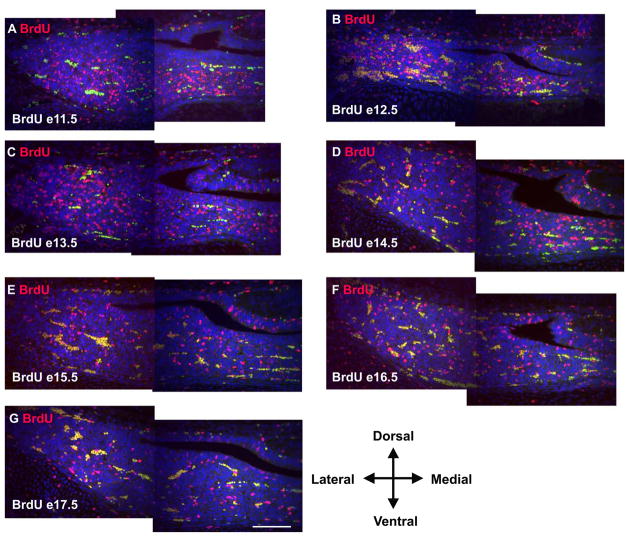
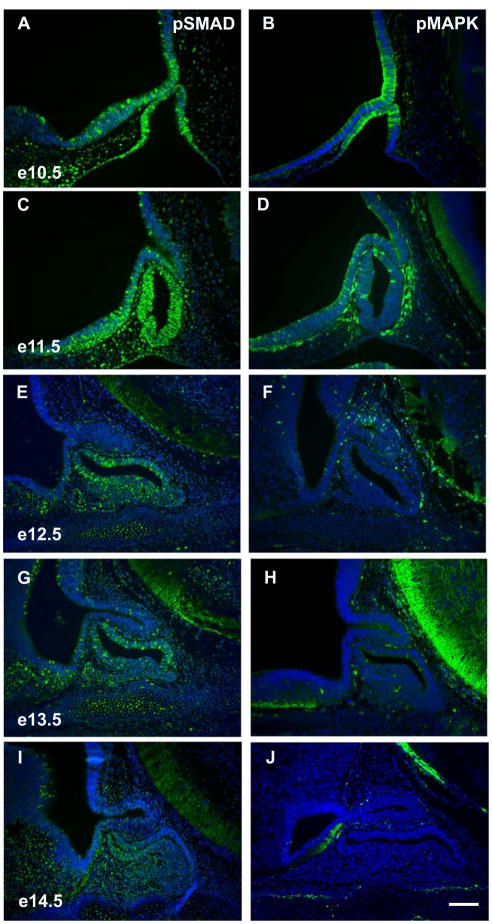
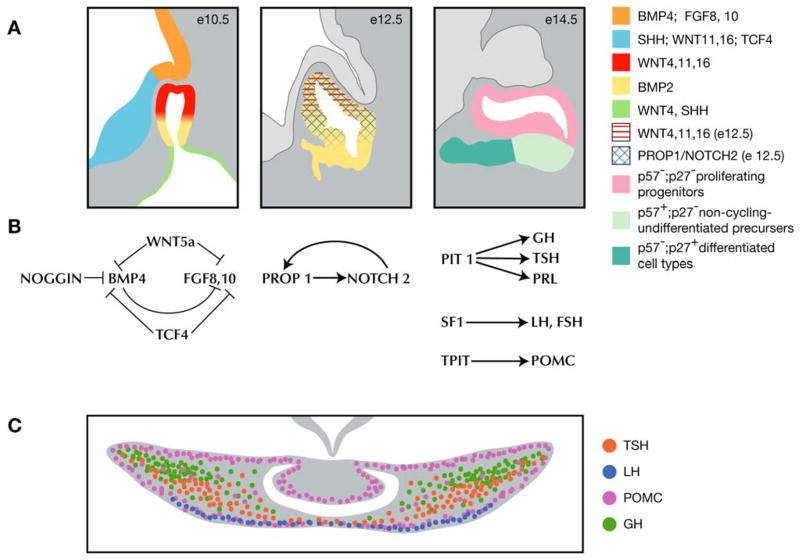
The intermediate and anterior lobes of the pituitary gland are derived from an invagination of oral ectoderm that forms Rathke's pouch. During gestation proliferating cells are enriched around the pouch lumen, and they appear to delaminate as they exit the cell cycle and differentiate. During late mouse gestation and the postnatal period, anterior lobe progenitors re-enter the cell cycle and expand the populations of specialized, hormone-producing cells. At birth, all cell types are present, and their localization appears stratified based on cell type. We conducted a birth dating study of Rathke's pouch derivatives to determine whether the location of specialized cells at birth is correlated with the timing of cell cycle exit. We find that all of the anterior lobe cell types initiate differentiation concurrently with a peak between e11.5 and e13.5. Differentiation of intermediate lobe melanotropes is delayed relative to anterior lobe cell types. We discovered that specialized cell types are not grouped together based on birth date and are dispersed throughout the anterior lobe. Thus, the apparent stratification of specialized cells at birth is not correlated with cell cycle exit. Thus, the currently popular model of cell specification, dependent upon timing of extrinsic, directional gradients of signaling molecules, needs revision. We propose that signals intrinsic to Rathke's pouch are necessary for cell specification between e11.5 and e13.5 and that cell-cell communication likely plays an important role in regulating this process.


Figures

Figure 1
Figure 1
Corticotropes begin to differentiate early in pituitary organogenesis. (A-G) Immunohistochemistry for POMC (green), and BrdU (red), then counter-stained with DAPI (blue). BrdU was injected on e11.5 (A), e12.5 (B), e13.5 (C), e14.5 (D), e15.5 (E), e16.5 (F), and e17.5 (G) and the assay performed for all images at e17.5. Arrows highlight selected cells that are positive for both POMC and BrdU. All sections are coronal with dorsal towards the top and medial on the right. (H) Lower magnification of F with the area depicted in F boxed. a = anterior lobe; i = intermediate lobe; p = posterior lobe. (A – G) Similar regions of the pituitary in their respective embryos. Similar results were observed for LH, TSH, and GH (Supplemental figures 2–4). Scale bars equal 100 um. Scale bar in G applies to A-F.
Figure 2
Figure 2
Peak BrdU incorporation occurs early in pituitary organogenesis. (A) The average number of BrdU positive cells per mm2 of anterior lobe tissue for three individuals was determined for each embryonic day of BrdU injection. Error bars represent the standard deviation. (B) Signficant groupings as determined by one-way ANOVA. F (model degree of freedom, error degree of freedom) = F value
Figure 3
Figure 3
Gonadotropes are located more rostrally than somatotropes. (A) The total number of hormone positive cells was determined for each cell type listed. The proportion of the total for each cell type was determined for each caudal to rostral location across the pituitary. Points represent the mean for three individuals for each cell type and error bars represent the standard deviation. (B) Signficant groupings as determined by one-way ANOVA.
Figure 4
Figure 4
Pituitary gland birthdating reveals that differentiation of melanotropes occurs after anterior lobe cell types. (A) The total number of BrdU and hormone double-labeled cells was determined for each cell type listed, as well as, the total number of hormone positive cells. The bars represent the mean proportion of BrdU and hormone double-labeled cells out of the total hormone population for three individuals for each embryonic day of BrdU injection. Error bars represent the standard deviation. (B) Signficant groupings as determined by one-way ANOVA.
Figure 5
Figure 5
Most cells born after e13.5 do not express any hormones. (A) The total number of BrdU cells double labeled with either ACTH, GH, LH, and TSH was determined, as well as, the total number of BrdU positive cells. The bars represent the mean proportion of double-labeled cells out of the total BrdU positive population for each of three individuals for each embryonic day of BrdU injection. Error bars represent the standard deviation. (B) Significant groupings as determined by one-way ANOVA. (C) Double immunohistochemistry for TBX19 (green) and POMC (yellow). POMC was detected with Cy3, but appears yellow because of the cross-reaction from using two antibodies raised in rabbit. (D) Double immunohistochemistry for NR5A1 (green) and LH (red). Arrow indicates a NR5A1 positive cell that is negative for LH. (E) Double immunohistochemistry for POU1F1 (green) and GH and TSH (red). A Cy3 secondary was used to detect both GH and TSH. Arrow indicates a POU1F1 positive cell that is negative for GH and TSH. Scale bar in E equals 100 μm for C, D, and E.
Figure 6
Figure 6
SOX2 progenitor cells are constantly dividing throughout pituitary organogenesis. (A) Double immunohistochemistry for SOX2 (green) and BrdU (red). Arrows indicate SOX2 and BrdU double positive cells that are adjacent to the lumen and were counted as potential stem cells. Arrowhead indicates a SOX2 and BrdU double positive cells that is not adjacent to the lumen and was not counted as a potential stem cell. Scale bar equals 100 μm. (B) The total number of BrdU and SOX2 double-labeled cells was determined, as well as, the total number of SOX2 positive cells. The bars represent the mean proportion of BrdU and SOX2 double-labeled cells out of the total SOX2 population for three individuals for each embryonic day of BrdU injection. Error bars represent the standard deviation. (C) Significant groupings as determined by one-way ANOVA.
Figure 7
Figure 7
Hormone producing cells born on e12.5 are scattered throughout the anterior lobe. (A) The proportion of double-labeled BrdU and hormone positive cells out of the total number of hormone cells was determined for each location across the caudal to rostral axis when BrdU was injected on e12.5. Points represent the mean proportion for three individuals for each hormone indicated. Error bars represent the standard deviation. (C) Significant groupings as determined by one-way ANOVA.
Figure 8
Figure 8
Anterior lobe cells that differentiate concurrently are dispersed throughout the caudal to rostral axis of the anterior lobe. The total number of BrdU positive cells was determined for each day when BrdU was injected from e11.5 to e17.5. The proportion of the total for each day of BrdU injection was determined for each caudal to rostral location across the pituitary. Points represent the mean for three individuals for each cell type. Error bars represent the standard deviation. (C) Significant groupings as determined by one-way ANOVA for the e12.5 BrdU injection day.
Figure 9
Figure 9
Anterior lobe cells that differentiate concurrently are also dispersed throughout the dorsal to ventral and medial to lateral axes. BrdU was injected on e11.5 (A), e12.5 (B), e13.5 (C), e14.5 (D), e15.5 (E), e16.5 (F), and e17.5 (G) and immunohistochemistry was preformed at e17.5 for all images. Autofluorescent blood cells appear yellow as the image is a composite of exposures taken using both red and green filters. All images are coronal with medial on the right. Each image represents one half of the pituitary gland. Cells incorporating BrdU at each time point are distributed throughout the gland at e17.5 without being enriched in any preferred location. Scale bar equals 100 μm for all images.
Figure 10
Figure 10
pSMAD signaling, but not pMAPK signaling, is observed in Rathke’s pouch during pituitary cell specification. Immunohistochemistry for phosphorylated Smad 1, 5, and 8 (A, C, E, G, and I) and phosphorylated Mapk (B, D, F, H, and J). Time points assayed are e10.5 (A, B), e11.5 (C, D), e12.5 (E, F), 13.5 (G, H), and e14.5 (I, J). All sections are sagittal with dorsal at the top and rostral at the left. Scale bar equals 100 μm for all images.
Figure 11
Figure 11
Proposed model for pituitary gland development. (A) Spatial representation of extrinsic and intrinsic factors that influence development of Rathke’s pouch (Bilodeau et al. observed the transition zone of p57+ cells at e13.5, unpublished observations indicate that this transition zone is present at e14.5 as well (M. Brinkmeier personal communication). (B) Balance of extrinsic factors at e10.5 necessary for Rathke’s pouch development and known transcription factors that drive differentiation of anterior lobe cell types at e12.5 and e14.5. (C) Enrichment of cell types in the pituitary gland at e17.5 that results from the sorting of cells into networks following cell specification.

References

    1. Alba M, Salvatori R. A mouse with targeted ablation of the growth hormone-releasing hormone gene: a new model of isolated growth hormone deficiency. Endocrinology. 2004;145:4134–4143. - PubMed
    1. Baker BL, Gross DS. Cytology and distribution of secretory cell types in the mouse hypophysis as demonstrated with immunocytochemistry. Am J Anat. 1978;153:193–215. - PubMed
    1. Barnhart KM, Mellon PL. The orphan nuclear receptor, steroidogenic factor-1, regulates the glycoprotein hormone alpha-subunit gene in pituitary gonadotropes. Mol Endocrinol. 1994;8:878–885. - PubMed
    1. Bilodeau S, Roussel-Gervais A, Drouin J. Distinct developmental roles of cell cycle inhibitors p57Kip2 and p27Kip1 distinguish pituitary progenitor cell cycle exit from cell cycle reentry of differentiated cells. Mol Cell Biol. 2009;29:1895–1908. - PMC - PubMed
    1. Bonnefont X, Lacampagne A, Sanchez-Hormigo A, Fino E, Creff A, Mathieu MN, Smallwood S, Carmignac D, Fontanaud P, Travo P, Alonso G, Courtois-Coutry N, Pincus SM, Robinson IC, Mollard P. Revealing the large-scale network organization of growth hormone-secreting cells. Proc Natl Acad Sci U S A. 2005;102:16880–16885. - PMC - PubMed

Publication types

MeSH terms

Substances

LinkOut - more resources