. 2011 Mar;132(3):93-102.
doi: 10.1016/j.mad.2011.01.001. Epub 2011 Jan 22.

Age trajectories of physiological indices in relation to healthy life course

Affiliations

Age trajectories of physiological indices in relation to healthy life course

Konstantin G Arbeev et al. Mech Ageing Dev. 2011 Mar.

Abstract

We analysed relationship between the risk of onset of "unhealthy life" (defined as the onset of cancer, cardiovascular diseases, or diabetes) and longitudinal changes in body mass index, diastolic blood pressure, hematocrit, pulse pressure, pulse rate, and serum cholesterol in the Framingham Heart Study (Original Cohort) using the stochastic process model of human mortality and aging. The analyses demonstrate how decline in resistance to stresses and adaptive capacity accompanying human aging can be evaluated from longitudinal data. We showed how these components of the aging process, as well as deviation of the trajectories of physiological indices from those minimising the risk at respective ages, can lead to an increase in the risk of onset of unhealthy life with age. The results indicate the presence of substantial gender difference in aging related decline in stress resistance and adaptive capacity, which can contribute to differences in the shape of the sex-specific patterns of incidence rates of aging related diseases.


Figures

Fig. 1
Fig. 1
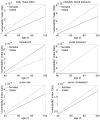
Average trajectories (±s.e.) of six physiological indices in females and males in the Framingham Heart Study (original cohort). Note: values of the indices measured after the onset of any of the three diseases defining “unhealthy life” (i.e., cancer, CVD, diabetes) are excluded from the calculations.
Fig. 2
Fig. 2
Incidence rates (±s.e.) of onset of “unhealthy life” (i.e., cancer, CVD, or diabetes) in females and males in the Framingham Heart Study (original cohort)
Fig. 3
Fig. 3
Illustration of the quadratic hazard model for a hypothetical physiological index Yt (mimicking pulse pressure, PP): increase of the hazard rate compared to the baseline level (i.e.,μ(t,Yt)– μ0(t) = (Ytf (t))2 Q(t)) for ages 50 and 90. Compared to age 50, individuals at age 90 tend to have a larger increase in the risk (denoted by the dotted line) as the result of larger deviations of the trajectory of the index (Yt, thin solid line) from the “optimal” trajectory (f(t), dash-dotted line) caused by the divergent trajectory of the “mean allostatic state” (f1(t), dashed line) that an organism is forced to follow by the process of adaptive regulation, and a narrower U-shape of the risk (μ(t,Yt) – μ0(t), thick solid line).
Fig. 4
Fig. 4
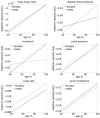
Estimates of the baseline hazard rate (μ0(t)) in the quadratic hazard model applied to data on onset of “unhealthy life” (i.e., cancer, CVD, or diabetes) and longitudinal observations of body mass index, diastolic blood pressure, hematocrit, pulse pressure, pulse rate, and serum cholesterol, in females (solid lines) and males (dashed lines) in the Framingham Heart Study (original cohort)
Fig. 5
Fig. 5
Estimates of the “vulnerability” index (Q(t)) in the quadratic hazard model applied to data on onset of “unhealthy life” (i.e., cancer, CVD, or diabetes) and longitudinal observations of body mass index, diastolic blood pressure, hematocrit, pulse pressure, pulse rate, and serum cholesterol, in females (solid lines) and males (dashed lines) in the Framingham Heart Study (original cohort)
Fig. 6
Fig. 6
Estimates of age-specific adaptive capacity (i.e., the negative feedback coefficient a(t)) in the quadratic hazard model applied to data on onset of “unhealthy life” (i.e., cancer, CVD, or diabetes) and longitudinal observations of body mass index, diastolic blood pressure, hematocrit, pulse pressure, pulse rate, and serum cholesterol, in females (solid lines) and males (dashed lines) in the Framingham Heart Study (original cohort)

References

    1. Allison DB, Faith MS, Heo M, Kotler DP. Hypothesis concerning the U-shaped relation between body mass index and mortality. Am. J. Epidemiol. 1997;146(4):339–349. - PubMed
    1. Arbeev KG, Akushevich I, Kulminski AM, Arbeeva LS, Akushevich L, Ukraintseva SV, Culminskaya IV, Yashin AI. Genetic model for longitudinal studies of aging, health, and longevity and its potential application to incomplete data. J. Theor. Biol. 2009;258(1):103–111. - PMC - PubMed
    1. Arbeev KG, Ukraintseva SV, Arbeeva LS, Yashin AI. Mathematical models for human cancer incidence rates. Demographic Research. 2005;12(10):237–271.
    1. Bagdonavicius V, Nikulin M. Statistical Models to Analyze Failure, Wear, Fatigue, and Degradation Data with Explanatory Variables. Communications in Statistics - Theory and Methods. 2009;38(16-17):3031–3047.
    1. Boutitie F, Gueyffier F, Pocock S, Fagard R, Boissel JP. J-shaped relationship between blood pressure and mortality in hypertensive patients: New insights from a meta-analysis of individual-patient data. Ann. Intern. Med. 2002;136(6):438–448. - PubMed

Publication types