. 2011 Jan 27;69(2):258-72.
doi: 10.1016/j.neuron.2011.01.001.

The molecular and cellular basis of bitter taste in Drosophila

Affiliations

The molecular and cellular basis of bitter taste in Drosophila

Linnea A Weiss et al. Neuron. .

Abstract

The extent of diversity among bitter-sensing neurons is a fundamental issue in the field of taste. Data are limited and conflicting as to whether bitter neurons are broadly tuned and uniform, resulting in indiscriminate avoidance of bitter stimuli, or diverse, allowing a more discerning evaluation of food sources. We provide a systematic analysis of how bitter taste is encoded by the major taste organ of the Drosophila head, the labellum. Each of 16 bitter compounds is tested physiologically against all 31 taste hairs, revealing responses that are diverse in magnitude and dynamics. Four functional classes of bitter neurons are defined. Four corresponding classes are defined through expression analysis of all 68 gustatory taste receptors. A receptor-to-neuron-to-tastant map is constructed. Misexpression of one receptor confers bitter responses as predicted by the map. These results reveal a degree of complexity that greatly expands the capacity of the system to encode bitter taste.


Figures

Figure 1
Figure 1
The Drosophila labellum and its physiological responses. (A) A typical Drosophila labellum is comprised of two labellar palps, each of which has 31 sensilla that are categorized and numbered based on their position and morphology. We observe some variation in the number of sensilla; e.g. either S0 or S1 is missing in 54% of labella (n = 78), and the number of anterolateral I sensilla (I0–I5) ranges between 5 ≤n≤ 8 (n = 67). Sensilla are shaded according to their morphological classes. “A” is anterior, “P” is posterior, “M” is medial and “L” is lateral. The numbering and classification of individual sensilla differ slightly from the previous literature (Hiroi et al., 2002; Shanbhag et al., 2001) in order to reflect observations in our laboratory strain. (B and C) Sample traces of physiological recordings from the S6 (B) and S9 (C) sensilla. Control traces using the diluent, tricholine citrate (TCC), are shown for both sensilla. (D) Sample traces of physiological recordings from I5 (left) and I9 (right) sensilla presented with DEN or TPH demonstrate functional heterogeneity among sensilla. The arrow indicates the contact artifact observed at the beginning of each trace. See Experimental Procedures for tastant abbreviations.
Figure 2
Figure 2
Drosophila avoid ingesting bitter tastants in a two-choice assay. (A) Flies are allowed to feed on microtiter plates containing alternating wells of either 1 mM sucrose, labeled with a red dye, or a solution of 5 mM sucrose mixed with a bitter tastant, labeled with a blue dye (left). The abdomens are scored as red, blue, purple or uncolored, indicating that the fly ingested the red solution, the blue solution, both solutions, or neither solution (right). (B) The preference indices (P.I.) are plotted for five representative bitter compounds over a range of concentrations; results for other bitter compounds are shown in Figure S1. Error bars are SEM. The dotted line labeled “P.I.max” indicates the preference for 1 mM sucrose when no bitter is present in the 5 mM sucrose solution (P.I. = 0.71); “P.I.IA” indicates the P.I. for which the two solutions are isoattractive (P.I.IA = 0.36). The vertical dotted line indicates the isoattractive concentration for denatonium. (C) Isoattractive concentrations for each bitter tastant. The isoattractive concentration for SAP is 0.37% but is not plotted in terms of molarity because it has a range of molecular weights (Figure S1B). For each data point, 6 ≤ n ≤ 7 trials. The mean percentage of flies that had colored abdomens, averaged over all concentrations of all compounds tested (n = 68), was 65.8%, ranging from 33.9% to 87.0%. (See also Figure S1.)
Figure 3
Figure 3
Labellar sensilla exhibit distinct response profiles to a panel of bitter tastants. The heat map shows the electrophysiological responses of labellar sensilla to a panel of 16 bitter tastants. Responses to the diluent control, 30 mM TCC, were subtracted from each value. Each sensillum's functional class, as described in Figure 4, is identified by a colored symbol for ease of comparison. For each data point, n ≥ 10. (See also Tables S1 and S2 for numerical values.)
Figure 4
Figure 4
Labellar sensilla can be clustered into five functional classes on the basis of response spectra. (A) Cluster analysis, based on Ward's method. The diluent control was subtracted from each response. The identity of I7 was variable and it has therefore not been assigned to any functional class. (B) Mean responses of all sensilla of a given functional class. Responses to the diluent control, TCC, were subtracted. Error bars are SEM. * “L, S-c” sensilla did not exhibit any observable physiological responses to any tested bitter compounds and no “bitter” neuron spikes were identified. The asterisk indicates that spikes from these sensilla were counted somewhat differently; we elected to count all spikes for these sensilla, which show high responses to the control diluent, TCC (Table S1). The activity of the water neuron decreases as osmolarity increases. Thus, the presence of a bitter tastant likely inhibits any remaining water neuron firing, resulting in the observed “negative” values. (C) Distribution of sensilla of each class.
Figure 5
Figure 5
Sensillar classes exhibit characteristic latencies in spike generation. (A) Sample traces illustrating typical delays in spike onset. Recordings are from the S6 sensillum stimulated with CAF, COU, SAP or GOS, and the S9 sensillum stimulated with ESC. (B) The mean delay in spike onset is shown for S-a (represented by S2, S6 and S7) and S-b (represented by S3, S5 and S9) sensilla in response to the indicated tastants. For individual sensilla (not including CAF), 6 ≤ n ≤ 16, with a mean of 9.8 traces analyzed. * = no response. (C) Sample traces of recordings from sensilla of the indicated functional classes stimulated with BER (left) or TPH (right). The time scales are expanded in order to illustrate clearly the delays in the onset of spike initiation. The spikes elicited from S3 by TPH have been marked with dots for clarity. (D) The mean delay in spike onset is shown for sensilla of the indicated functional classes in response to BER (left) or TPH (right). Bars are color-coded by sensillum class. 11 ≤ n ≤ 40, with a mean of 21 traces analyzed for each sensillum type. (E) Bursting responses of S9 sensilla to the indicated tastants. Error bars are SEM. (See also Figure S2.)
Figure 6
Figure 6
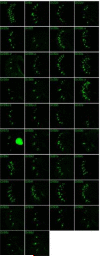
Expression of Gr-GAL4 drivers in gustatory sensory neurons of the labellum. Compressed z-stacks of single labellar palps, showing GFP reporter expression. All expression is neuronal, with the exception of a large area in the Gr57a-GAL4 labellum, tentatively identified as a salivary gland. (See also Figure S3.)
Figure 7
Figure 7
Individual bitter-sensitive sensilla express distinct subsets of Gr-GAL4 drivers. Gr-GAL4 drivers that are expressed in bitter neurons were mapped to individual sensilla. “+” indicates a mean expression value of 0.5 or greater (see Table S3); “−” indicates a value less than 0.5. “nd”, no data.
Figure 8
Figure 8
Labellar sensilla fall into five expression classes that are similar to the functional classes. (A) A hierarchical cluster analysis of sensilla based on their Gr gene expression profiles. Ward's method, using numerical data from Table S3, identifies five classes of sensilla. (A similar analysis using only data from Gr66a-expressing neurons generates identical classes.) These classes correspond well to the functionally identified classes (Figure 4) and are therefore labeled accordingly. (B) A receptor-to-neuron map is presented for the bitter (“B”) and sugar (“S”) neurons in all classes of labellar sensilla. (Note that “S” in this case refers to a neuron type and not a sensillum.) The “L” and “S-c” sensilla are grouped together since they generally do not express the “bitter” Gr-GAL4 drivers, but are indicated separately to reflect differences in the expression profiles of their sugar neurons. We observed expression of Gr28a-GAL4 and Gr39a.a-GAL4 in L sensilla but have not mapped them to neurons; there is evidence that the Gr28a-GAL4 driver is expressed in S neurons of L sensilla (Thorne and Amrein, 2008). I0 and I7 do not fit easily into any sensillum class and are therefore not included.
Figure 9
Figure 9
Misexpression of a receptor confers physiological responses. (A) Sample traces of recordings from I-b and S-a sensilla of the indicated genotypes stimulated with BER. (B) Mean responses of six sensilla representing all four bitter-responsive classes of labellar sensilla to BER, DEN or LOB. 8 ≤ n ≤ 22, with a mean of 12 recordings. Similar results were observed for all sensilla of a given class (data not shown). Error bars are SEM. The following genotypes were used: Sp/CyO; Gr66a-GAL4/TM3 or UAS-Gr59c/CyO; Gr66a-GAL4/TM3. (See also Figure S4.)

References

    1. Adler E, Hoon MA, Mueller KL, Chandrashekar J, Ryba NJ, Zuker CS. A novel family of mammalian taste receptors. Cell. 2000;100:693–702. - PubMed
    1. Bai L, Carlson JR. Distinct functions of acj6 splice forms in odor receptor gene choice. J Neurosci. 2010;30:5028–5036. - PMC - PubMed
    1. Bai L, Goldman AL, Carlson JR. Positive and negative regulation of odor receptor gene choice in Drosophila by acj6. J Neurosci. 2009;29:12940–12947. - PMC - PubMed
    1. Bargmann CI. Chemosensation in C. elegans. WormBook. 2006:1–29. - PMC - PubMed
    1. Benton R, Sachse S, Michnick SW, Vosshall LB. Atypical membrane topology and heteromeric function of Drosophila odorant receptors in vivo. PLoS Biol. 2006;4:e20. - PMC - PubMed

Publication types

LinkOut - more resources