. 2011 Jan 27;69(2):304-16.
doi: 10.1016/j.neuron.2010.12.014.

RIM determines Ca²+ channel density and vesicle docking at the presynaptic active zone

Affiliations

RIM determines Ca²+ channel density and vesicle docking at the presynaptic active zone

Yunyun Han et al. Neuron. .

Abstract

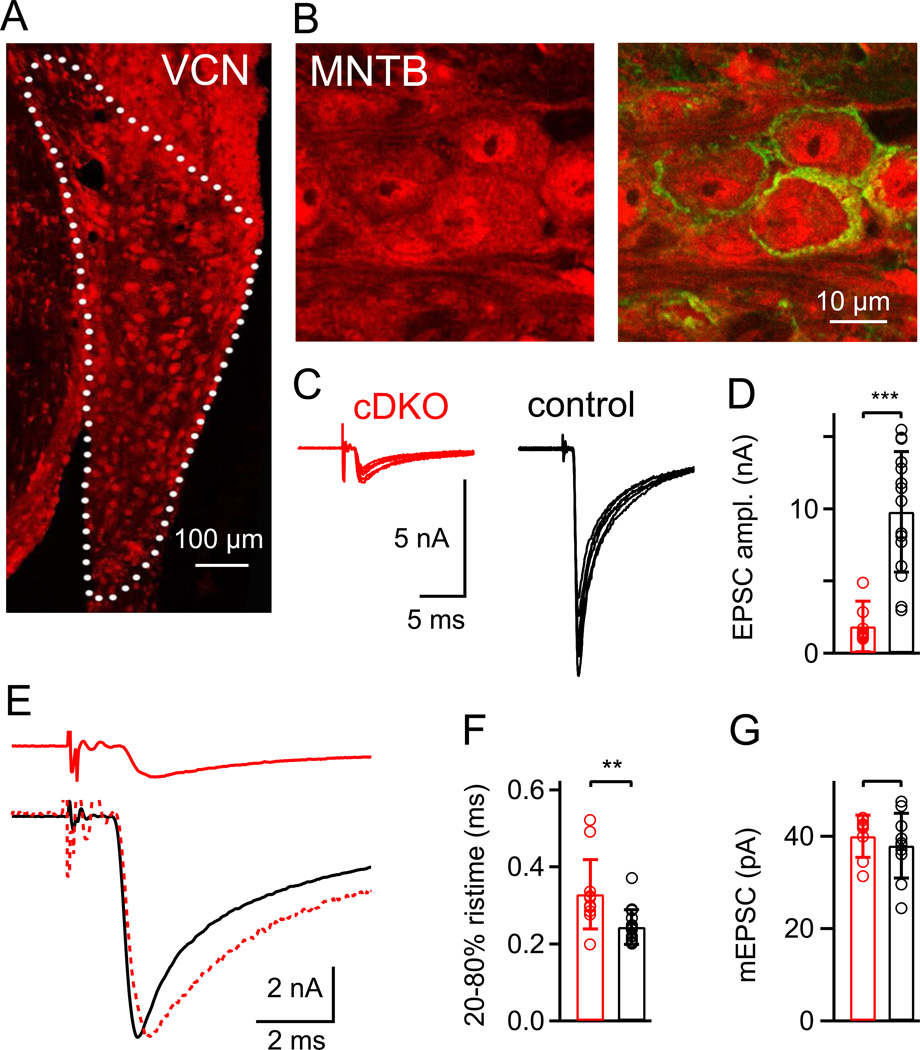
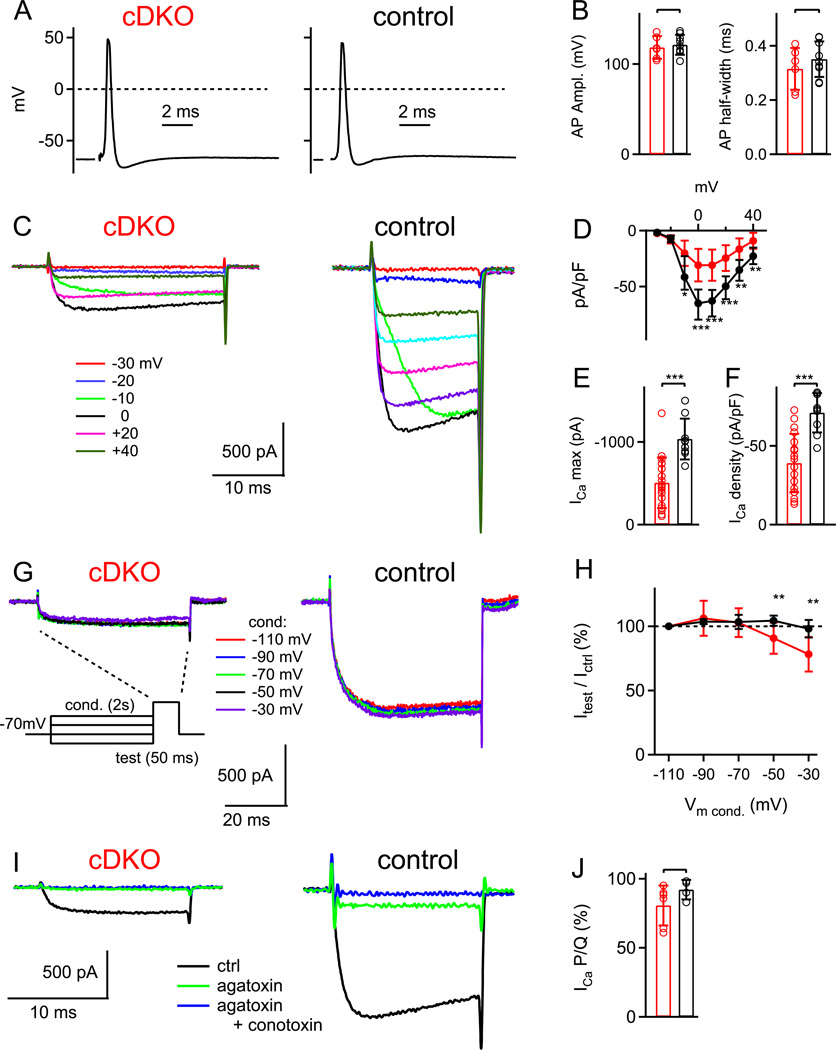
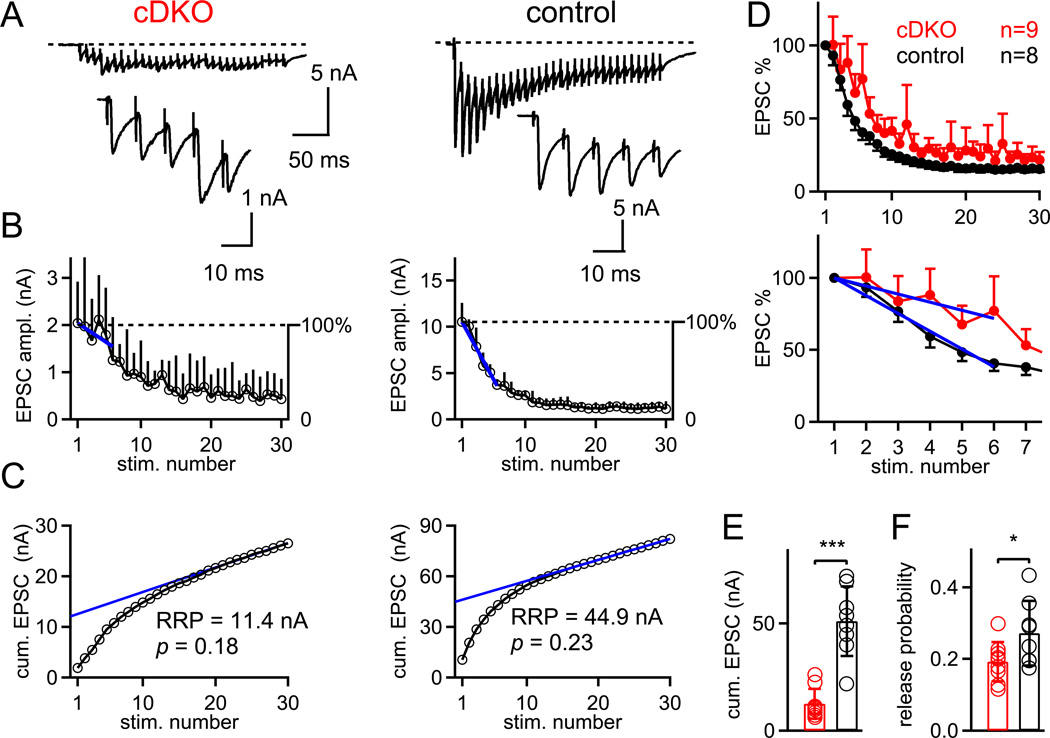
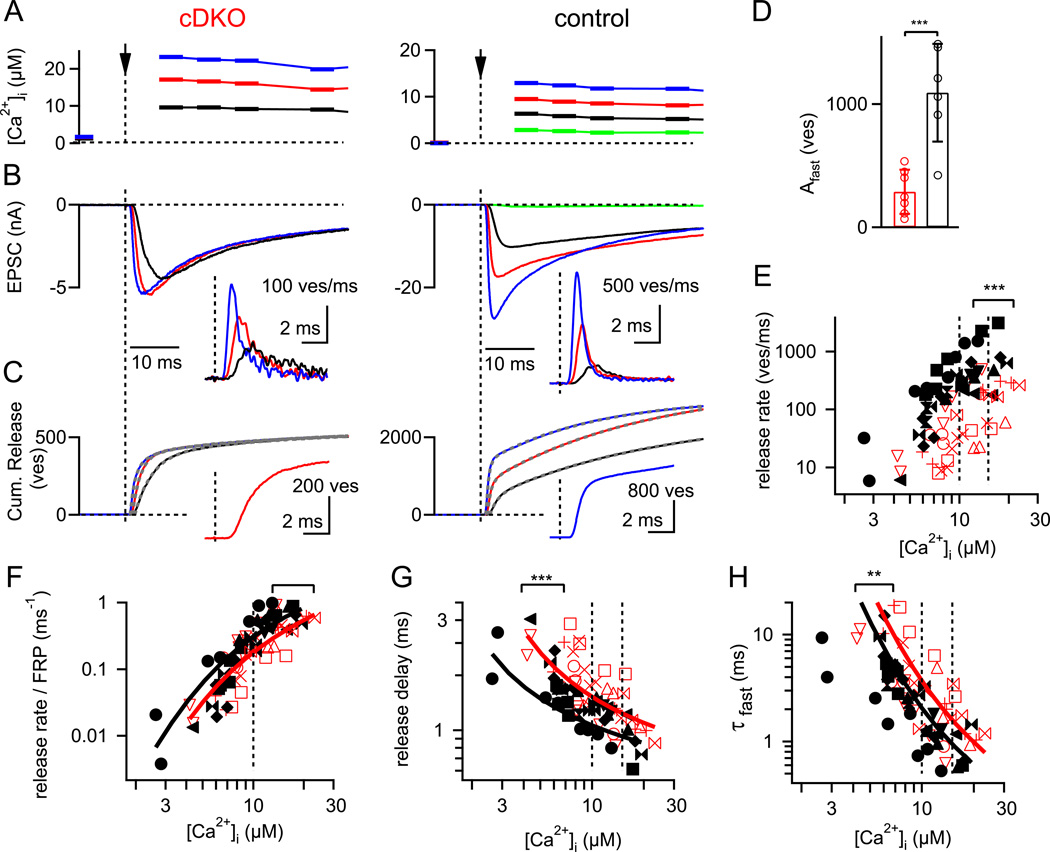
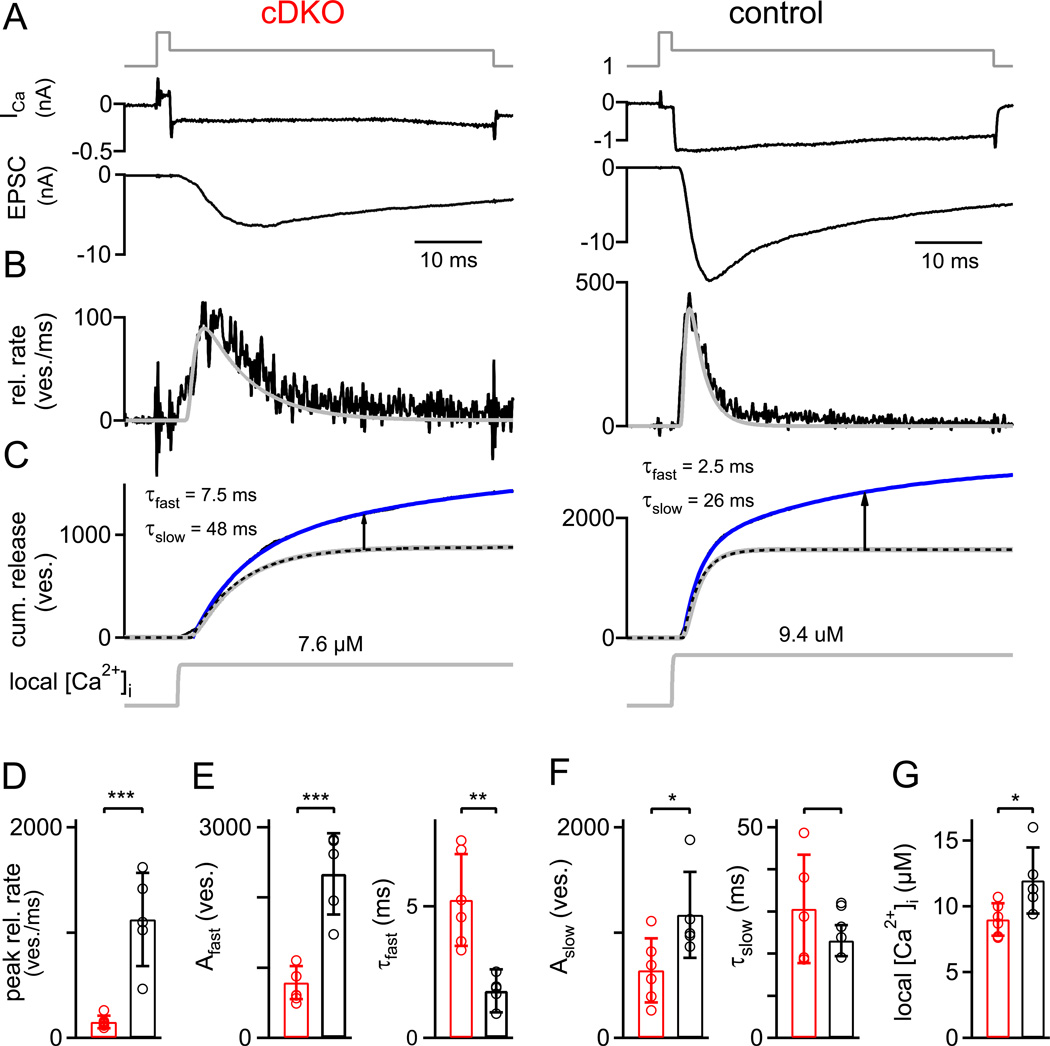
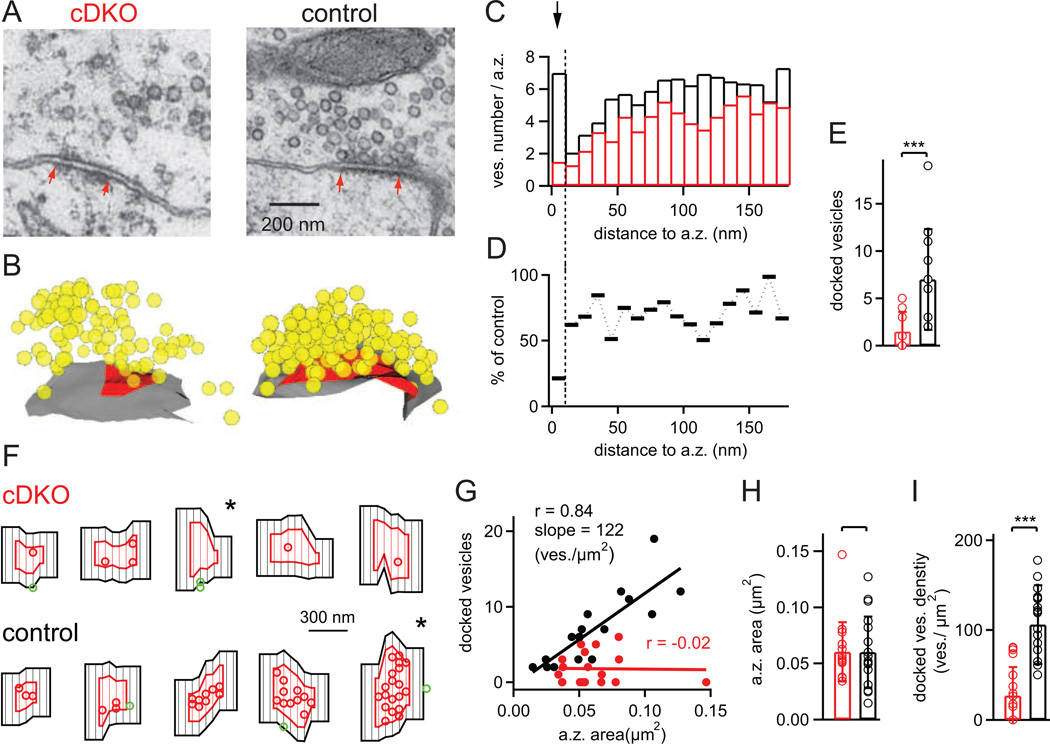
At presynaptic active zones, neurotransmitter release is initiated by the opening of voltage-gated Ca²+ channels close to docked vesicles. The mechanisms that enrich Ca²+ channels at active zones are, however, largely unknown, possibly because of the limited presynaptic accessibility of most synapses. Here, we have established a Cre-lox based conditional knockout approach at a presynaptically accessible central nervous system synapse, the calyx of Held, to directly study the functions of RIM proteins. Removal of all RIM1/2 isoforms strongly reduced the presynaptic Ca²+ channel density, revealing a role of RIM proteins in Ca²+ channel targeting. Removal of RIMs also reduced the readily releasable pool, paralleled by a similar reduction of the number of docked vesicles, and the Ca²+ channel-vesicle coupling was decreased. Thus, RIM proteins co-ordinately regulate key functions for fast transmitter release, enabling a high presynaptic Ca²+ channel density and vesicle docking at the active zone.


Figures

Figure 1
Figure 1. Conditional removal of RIM1/2 in the auditory brainstem leads to strong reduction of transmitter release at the calyx of Held
(A, B) Krox20-driven Cre activity in the VCN (A) and MNTB (B), as revealed by anti-RFP immunohistochemistry (red channel) using a td-RFP reporter mouse. In (A), Cre activity was observed in many VCN neurons, most likely including globular bushy cells which give rise to calyces of Held. Correspondingly, in (B), immunohistochemistry against RFP and against the presynaptic marker Synaptotagmin-2 (green channel; right) shows the presence of RFP in presynaptic calyces of Held, as well as in MNTB principal cells. (C) Fiber stimulation-evoked EPSCs at the calyx of Held synapse of a Cre-positive, RIM1lox/Δ, RIM2lox/Δ mouse (referred to as "cDKO"; left), and in a Cre-negative control mouse (right). N = 6 consecutive traces are shown for individual cells. (D) Average and individual values of evoked EPSC amplitudes in RIM1/2 cDKO synapses (n = 12 cells) and in control synapses (n = 15 cells). (E) Average EPSC traces of the same cells as shown in (C). The lower panel shows an overlay of the EPSC from a control mouse, and a peak-scaled EPSC from a RIM1/2 cDKO mouse, to illustrate a slight slowing of the EPSC rise time in the RIM1/2 cDKO mice. (F) Average and individual values of the 20 – 80 % rise times. There was a small, but significant (p = 0.0038) slowing in RIM1/2 cDKO mice. (G) Average and individual values of mEPSC amplitudes in the two genotypes; there was no statistically significant difference (p > 0.05). In this and all subsequent Figures, red and black symbols refer to data from RIM1/2 cDKO synapses and control synapses respectively. Star symbols indicate statistical significance (*, p < 0.05; **, p < 0.01; and ***, p < 0.001); a bracket without star symbol indicates no statistical significance (p > 0.05; Student's t-test). Error bars = SD. See also Figure S1.
Figure 2
Figure 2. A strong reduction of Ca2+ current density in nerve terminals of RIM1/2 cDKO mice
(A, B) Presynaptic action potentials (APs) recorded in RIM1/2 cDKO calyces (A, left), and in control calyces (A, right) following afferent fiber stimulation. The average AP amplitudes and AP-halfwidths were unchanged in RIM1/2 cDKO calyces (B). (C) Ca2+ currents evoked by voltage-steps to the indicated membrane potentials in a RIM1/2 cDKO calyx (left) and in a control calyx (right). (D) Current-voltage relationship of Ca2+ currents normalized by presynaptic membrane capacitance (Cm), averaged for n = 19 RIM1/2 cDKO calyces, and for n = 9 control calyces. (E, F) Peak Ca2+ current amplitude (E) and (C) Ca2+ current density following normalization by the presynaptic Cm in RIM1/2 cDKO calyces (red) and in control calyces (black). (G, H) Presynaptic Ca2+ currents in response to a 50 ms test pulse to 0 mV, recorded after conditioning pre-pulses of 2s duration to the indicated membrane potentials. Note that negative pre-pulses did not reveal any significant steady-state inactivation at −70 mV, the holding potential standardly used here. In (H), the percentage of the current measured during the test pulse, relative to the current obtained for the most negative conditioning pulse, is given. (I, J) Sequential block of presynaptic Ca2+ currents by ω-agatoxin-IVa (agatoxin, 0.2 µM; green trace), and by the subsequent application of ω-conotoxinGVIa (conotoxin, 3 µM) in the continuous presence of agatoxin (blue traces). The fraction of the total Ca2+ current blocked by agaIVa in the two genotypes was unchanged (J). Error bars = SD. See also Figure S2.
Figure 3
Figure 3. Train stimulation and short term plasticity experiments indicate a reduced pool size and a slightly lowered release probability
(A) Example single ESPC traces in response to 100 Hz trains of afferent fiber stimulations in a RIM1/2 cDKO synapse (left) and in a control synapse (right). The first five EPSCs during the train are shown on increased scales in the insets. (B) EPSC depression curves averaged over 6 and 7 trials for the same cells as shown in (A). The first six data points following normalization to the first EPSC amplitude (see right-hand y-axis) were fitted with linear functions to quantify the onset of depression in both genotypes (blue fit lines). (C) Cumulative EPSC amplitude plots for the two cells shown in (A, B). Back-extrapolation to time zero yields the recovery-corrected pool size estimate (Schneggenburger et al., 1999). Note the much smaller value in the RIM1/2 cDKO neuron (left) as compared to the control cell (right). Data in A–C are from corresponding recordings. (D) Plot of the normalized EPSC amplitudes during 100 Hz trains, averaged for all RIM1/2 cDKO (n = 9 cells) and control cells (n = 8). The lower panel shows the data on an expanded time scale, together with the line fits to the average data set (blue lines). Error bars represent S.E.M. (E, F). Individual and average values of the pool size estimate (E) and of the release probability (F) for RIM1/2 cDKO (red) and control synapses (black). Error bars = SD (except panel D; = SEM).
Figure 4
Figure 4. Presynaptic Ca2+ uncaging reveals a smaller readily-releasable pool and a decrease in the intrinsic Ca2+ sensitivity
(A – C) Ca2+ uncaging - evoked elevation of presynaptic [Ca2+]i (A), postsynaptic EPSCs (B), and cumulative transmitter release (C) in a RIM1/2 cDKO (left) and control synapse (right). The insets in (B) show the transmitter release rates. Note the much smaller Ca2+ uncaging - evoked EPSCs in the RIM1/2 cDKO synapse, which indicate a strongly reduced readily-releasable pool. The cumulative release traces in (C) were best fitted with double-exponential, or double-exponential plus line functions (Dashed grey traces; see Experimental Procedures). The insets in (C) show cumulative release traces in response to roughly similar [Ca2+]i steps (~ 15 µM) on an expanded time-scale, to illustrate the slowed rise and longer delay in RIM1/2 cDKO synapses. (D) The number of fast-released vesicles for [Ca2+]i steps in the range of 10 – 15 µM, as obtained by the amplitude parameter of the fast fit component of double-exponential fits to the cumulative release traces (see C). (E) Plot of the peak transmitter release rates as a function of the [Ca2+]i step amplitude for both genotypes. The statistical significance between the data sets was determined by ANCOVA (p < 0.001). (F – H) Pool-normalized peak release rate (F), release delays (G) and the time constant of the fast release component (H), plotted against the amplitude of the [Ca2+]i steps. Note the significantly slower release delays (G) (p < 0.001; ANCOVA) and fast release time constants (H) (p < 0.01; ANCOVA). The five site model of Ca2+ binding and vesicle fusion (Schneggenburger and Neher, 2000) was globally fitted to all three data sets (F, G, H), for each genotype. The resulting fit parameters indicate that slowed Ca2+ - binding (decreased on-rate, and slightly decreased off-rate; see Experimental Procedures for parameters) could describe the data in the RIM1/2 cDKO synapses. Error bars = SD.
Figure 5
Figure 5. Paired pre- and postsynaptic recordings show a deficit in Ca2+ channel - release coupling in addition to the strongly decreased pool size
(A–C) Transmitter release in response to prolonged presynaptic depolarizations. Ca2+ currents and EPSCs (A, upper and lower panel), release rates (B), traces of cumulative release (C, upper), and the back-calculated local [Ca2+]i signal (C, lower) are shown. The double-exponential (best) fit of the cumulative release traces is overlaid as a blue line over the data (black lines, not visible). The dotted black traces in (C) are the fast components of the double exponential fits. The grey traces overlaid over the transmitter release rates (B) and the fast release component (C) are the predicted release rates determined by the back-calculation approach using the five -site model of Ca2+ binding and vesicle fusion (Schneggenburger and Neher, 2000), which effectively models the fast release component. The arrows show the estimated amplitude of the slow release component at a time of 30 ms. (D) Average peak release rates of both genotypes. (E) Estimate of FRP obtained from the amplitude parameter of the fast release component (left, in number of vesicles), and time-constant of the fast release component (right), for both genotypes. (F) Number of slowly-released vesicles (left) and slow release time-constant (right), for both genotypes. (G) Average and individual values of the amplitude of the back-calculated local [Ca2+]i as shown in C (lower panel; grey traces). Note the slightly, but significantly (p = 0.03) smaller local [Ca2+]i that was back-calculated for the RIM1/2 cDKO synapses. Error bars = SD. See also Figure S3.
Figure 6
Figure 6. RIM1/2 docks vesicles to the presynaptic active zone
(A, B) Representative single EM images of calyceal active zones, and three-dimensional reconstructions of the corresponding active zones from a RIM1/2 cDKO mouse (left), and from a control mouse (right) from the same P11 litter. Red arrows in (A) indicate the extent of the postsynaptic density, which was used to measure the active zone sizes. In (B), vesicles are shown in yellow; active zone membrane is indicated in red. (C) Average histogram of vesicle numbers located at different distances to the active zone; bin width = 10 nm (n = 18 and n = 17 active zones for RIM1/2 cDKO and control mice respectively). Note that in control synapses, the bin at the shortest distance shows a peak which likely represents the pool of docked vesicles; this peak was strongly reduced in RIM1/2 cDKO synapses (see arrow). (D) Percentage value of average vesicle numbers shown in (C), calculated as RIM1/2 cDKO values relative to control. Note the much stronger reduction for the membrane-nearest bin (10 nm and less), indicating a strong vesicle docking deficit in RIM1/2 cDKO mice. (E) Average number of docked vesicles, defined as vesicles located within 10 nm from the active zone membrane. Note the significant decrease in the number of docked vesicles in RIM1/2 cDKO synapses (p < 0.001). Also note that due to integer numbers, not all data points are visible (n = 18 and 17 for RIM1/2 cDKO and control, respectively). (F) Examples of flat surface rendered active zones (red) and adjacent membrane (black) within 100 nm distance from the active zone boarder. Docked vesicles within the active zone and outside are shown as red and green circles, respectively. Five examples for RIM1/2 cDKO (upper row) and for control active zones are shown, ordered according to increasing active zone surface. Note the strongly reduced density of docked vesicles in RIM1/2 cDKO synapses, and the only small number of "outlier" vesicles adjacent to the active zone in both genotypes. The star symbols mark the example active zones shown in (A, B). (G) Plot of the number of docked vesicles versus active zone area. Linear regression showed a good correlation and near-linear relationship in the control data with the indicated regression coeeficient and slope. In the RIM1/2 cDKO, the data was dominated by a low number of docked vesicles irrespective of active zone size. (H, I) Average and individual values of active zone area (H), and docked vesicle density per µm2 of active zone membrane (I). The latter values were obtained by normalizing the docked vesicle numbers (E) to the corresponding active zone area (H). Error bars = SD. See also Table S1.

Comment in

  • The multiple faces of RIM.
    Pernía-Andrade A, Jonas P. Pernía-Andrade A, et al. Neuron. 2011 Jan 27;69(2):185-7. doi: 10.1016/j.neuron.2011.01.010. Neuron. 2011. PMID: 21262457

References

    1. Augustin I, Rosenmund C, Südhof TC, Brose N. Munc13-1 is essential for fusion competence of glutamatergic synaptic vesicles. Nature. 1999;400:457–461. - PubMed
    1. Betz A, Thakur P, Junge HJ, Ashery U, Rhee JS, Scheuss V, Rosenmund C, Rettig J, Brose N. Functional interaction of the active zone proteins Munc13-1 and RIM1 in synaptic vesicle priming. Neuron. 2001;30:183–196. - PubMed
    1. Borst JG, Sakmann B. Calcium influx and transmitter release in a fast CNS synapse. Nature. 1996;383:431–434. - PubMed
    1. Bucurenciu I, Kulik A, Schwaller B, Frotscher M, Jonas P. Nanodomain coupling between Ca2+ channels and Ca2+ sensors promotes fast and efficient transmitter release at a cortical GABAergic synapse. Neuron. 2008;57:536–545. - PubMed
    1. Calakos N, Schoch S, Südhof TC, Malenka RC. Multiple roles for the active zone protein RIM1α in late stages of neurotransmitter release. Neuron. 2004;42:889–896. - PubMed

Publication types

MeSH terms