

Impacts of climate change on the world's most exceptional ecoregions
- PMID: 21262825
- PMCID: PMC3038729
- DOI: 10.1073/pnas.1007217108
Impacts of climate change on the world's most exceptional ecoregions
Abstract
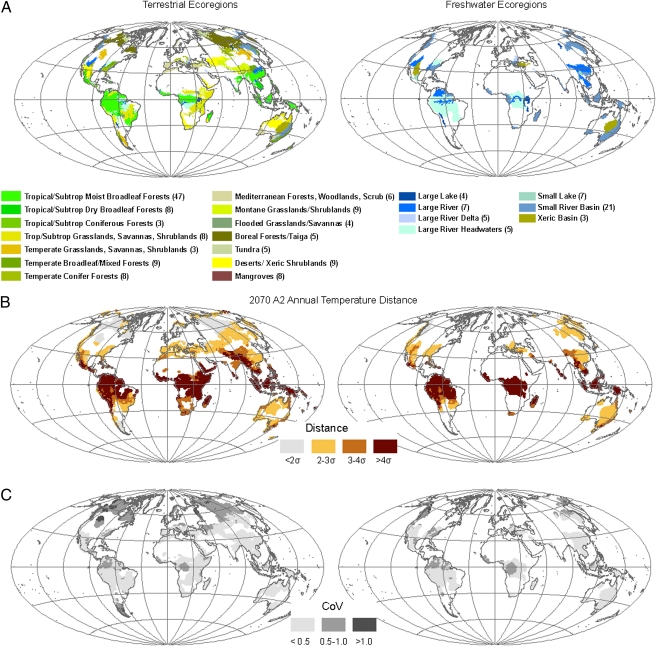
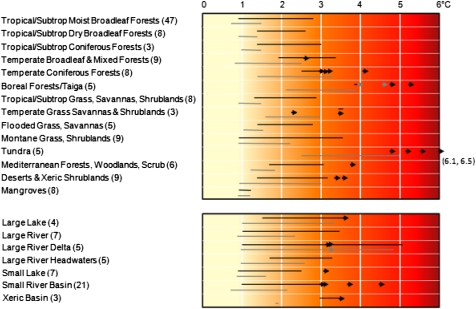
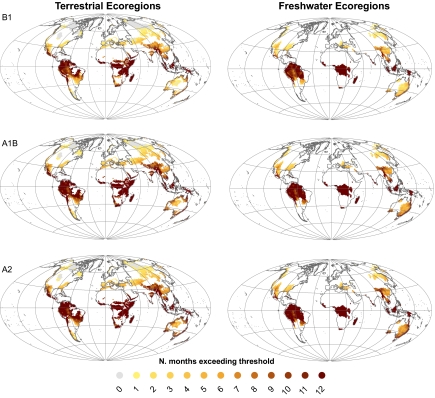
The current rate of warming due to increases in greenhouse gas (GHG) emissions is very likely unprecedented over the last 10,000 y. Although the majority of countries have adopted the view that global warming must be limited to <2 °C, current GHG emission rates and nonagreement at Copenhagen in December 2009 increase the likelihood of this limit being exceeded by 2100. Extensive evidence has linked major changes in biological systems to 20th century warming. The "Global 200" comprises 238 ecoregions of exceptional biodiversity [Olson DM, Dinerstein E (2002) Ann Mo Bot Gard 89:199-224]. We assess the likelihood that, by 2070, these iconic ecoregions will regularly experience monthly climatic conditions that were extreme in 1961-1990. Using >600 realizations from climate model ensembles, we show that up to 86% of terrestrial and 83% of freshwater ecoregions will be exposed to average monthly temperature patterns >2 SDs (2σ) of the 1961-1990 baseline, including 82% of critically endangered ecoregions. The entire range of 89 ecoregions will experience extreme monthly temperatures with a local warming of <2 °C. Tropical and subtropical ecoregions, and mangroves, face extreme conditions earliest, some with <1 °C warming. In contrast, few ecoregions within Boreal Forests and Tundra biomes will experience such extremes this century. On average, precipitation regimes do not exceed 2σ of the baseline period, although considerable variability exists across the climate realizations. Further, the strength of the correlation between seasonal temperature and precipitation changes over numerous ecoregions. These results suggest many Global 200 ecoregions may be under substantial climatic stress by 2100.
Conflict of interest statement
The authors declare no conflict of interest.
Figures
References
-
- Butchart SHM, et al. Global biodiversity: Indicators of recent declines. Science. 2010;330:329–330.
-
- Rands MRW, et al. Biodiversity conservation: Challenges beyond 2010. Science. 2010;330:329–330. - PubMed
-
- Pereira HM, et al. Scenarios for global biodiversity in the 21st century. Science. 2010;330:1496–1501. 10.1126/science.1196624. - PubMed
-
- Thomas CD, et al. Extinction risk from climate change. Nature. 2004;427:145–148. - PubMed
-
- Stork NE. Re-assessing current extinction rates. Biodivers Conserv. 2010;19:357–371.
Publication types
MeSH terms
LinkOut - more resources
Full Text Sources
