Comparative Study
. 2011 Mar 15;589(Pt 6):1421-42.
doi: 10.1113/jphysiol.2010.202804. Epub 2011 Jan 24.

Functional expression of transgenic 1sDHPR channels in adult mammalian skeletal muscle fibres

Affiliations
Comparative Study

Functional expression of transgenic 1sDHPR channels in adult mammalian skeletal muscle fibres

Marino DiFranco et al. J Physiol. .

Abstract

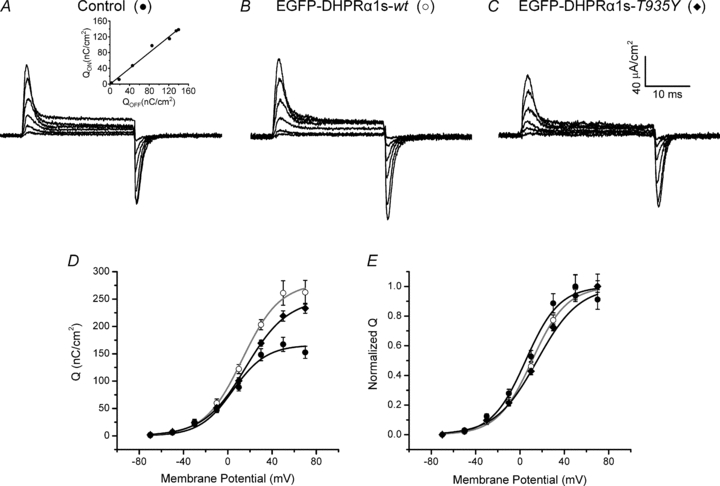
We investigated the effects of the overexpression of two enhanced green fluorescent protein (EGFP)-tagged α1sDHPR variants on Ca2+ currents (ICa), charge movements (Q) and SR Ca2+ release of muscle fibres isolated from adult mice. Flexor digitorum brevis (FDB)muscles were transfected by in vivo electroporation with plasmids encoding for EGFP-α1sDHPR-wt and EGFP-α1sDHPR-T935Y (an isradipine-insensitive mutant). Two-photon laser scanning microscopy (TPLSM) was used to study the subcellular localization of transgenic proteins, while ICa, Q and Ca2+ release were studied electrophysiologically and optically under voltage-clamp conditions. TPLSM images demonstrated that most of the transgenic α1sDHPR was correctly targeted to the transverse tubular system (TTS). Immunoblotting analysis of crude extracts of transfected fibres demonstrated the synthesis of bona fide transgenic EGFP-α1sDHPR-wt in quantities comparable to that of native α1sDHPR. Though expression of both transgenic variants of the alpha subunit of the dihydropyridine receptor (α1sDHPR) resulted in ∼50% increase in Q, they surprisingly had no effect on the maximal Ca2+ conductance (gCa) nor the SR Ca2+ release. Nonetheless, fibres expressing EGFP-α1sDHPR-T935Y exhibited up to 70% isradipine-insensitive ICa (ICa-ins) with a right-shifted voltage dependence compared to that in control fibres. Interestingly, Qand SRCa2+ release also displayed right-shifted voltage dependence in fibres expressing EGFP-α1sDHPR-T935Y. In contrast, the midpoints of the voltage dependence of gCa, Q and Ca2+ release were not different from those in control fibres and in fibres expressing EGFP-α1sDHPR-wt. Overall, our results suggest that transgenic α1sDHPRs are correctly trafficked and inserted in the TTS membrane, and that a substantial fraction of the mworks as conductive Ca2+ channels capable of physiologically controlling the release of Ca2+ from the SR. A plausible corollary of this work is that the expression of transgenic variants of the α1sDHPR leads to the replacement of native channels interacting with the ryanodine receptor 1 (RyR1), thus demonstrating the feasibility of molecular remodelling of the triads in adult skeletal muscle fibres.


Figures

Figure 1
Figure 1. Properties of ICa in untransfected fibres
A, family of currents elicited by depolarizing pulses from −90 mV. Traces are the currents recorded for depolarizations to +5, +10, +15, +20, +25, +30, +35, +60 and +70 mV. The tail currents are shown truncated. Their peak values are −30.5, −36.1, −48.7, −67.0, −90.0, −113.8, −131.7, −300.9 and −453.5 μA cm−2, respectively. ICa in response to depolarization to +30 mV (indicated by the asterisk) is shown in the inset together with exponential fits to the activation and decay (denoted by thin lines) phases. B, average peak ICa as a function of membrane potential. C, voltage dependence of gCa. The continuous line is the Boltzmann fit to the data. In B and C, filled circles and bars represent the mean ± SEM, respectively.
Figure 2
Figure 2. Expression and targeting of EGFP-α1s DHPR-wt
A, low magnification fluorescence TPLSM section of a branch of a transfected FDB muscle dissected 8 days after transfection. B, high magnification fluorescence TPLSM section of a group of fibres expressing EGFP-α1sDHPR-wt. The image was acquired from another area of the same muscle as in A. The white arrows indicate the maximum intensity of two consecutive EGFP fluorescence bands. C, back-scattered SHG signal corresponding to the image in B. The white arrowheads indicate the location of the maximum intensity of two consecutive SHG bands, which coincides with the M line. D, superposition of images in B and C. The relative position of arrows and arrowheads suggests that EGFP fluorescence bands are located at the T-tubules. E, enlarged view of the area defined by the rectangles in B and C. The labels for EGFP and SHG bands in B and C are included. F, intensity profiles of the EGFP fluorescence (thin) and SHG signal (thick) shown in E. The bar in A represents 150 μm. The length of the rectangles in panels B and C represents 15 μm.
Figure 3
Figure 3. Voltage dependence of ICa and gCa in fibres transfected with EGFP-α1sDHPR-wt
A, peak ICa plotted as a function of the membrane potential (open circles). B, voltage dependence of gCa (open circles). The data were fitted (continuous grey line) to a Boltzmann equation using gCa,max, V1/2 and k of 2.12 ± 0.13 mS cm−2 (or 0.43 ± 0.02 mS μF−1), 20.9 ± 1.7 mV and 6.89 ± 0.50 mV, respectively. For comparison, the ICaV and gCaV plots from control fibres (from Fig. 1) are shown superimposed (filled circles). Symbols and bars represent mean ± SEM.
Figure 4
Figure 4. Western blot analysis of α1s-DHPR-wt expression
Lanes A and B correspond to lysates obtained from 51 sham-transfected and 68 pEGFP-α1s-DHPR-wt-transfected fibres, respectively. The blots were developed with anti-DHPR antibody (see Methods). The normalized density for band b of lane A is 1.14; the normalized density for bands a and b of lane B are 0.8 and 0.83, respectively. Lane C correspond to a lysate from 65 transfected fibres, but developed with anti-EGFP antibody (see Methods). The numbers on the left indicate the MM of markers. Bands a, b and c correspond to the molecular masses of EGFP-α1s-DHPR-wt, native α1s-DHPR and calsequestrin, respectively.
Figure 5
Figure 5. Isradipine sensitivity of ICa in control and EGFP-α1sDHPR-wt transfected fibres
A, concentration-dependent blockage of ICa by isradipine (dose–response) in control fibres. The open circles and bars are the mean ± SEM. B, effect of 1 μm isradipine on ICa elicited by a depolarization to +35 mV in a control fibre. The thin and thick traces represent the ICa recorded before and during the application of isradipine, respectively. C, effect of 1 μm isradipine on ICa elicited by a depolarization to +35 mV in a fibre expressing EGFP-α1sDHPR-wt. The thin and thick traces represent the ICa recorded before and during the application of isradipine, respectively. D, average peak ICa recorded from control (filled bars), sham-transfected (hatched bars) and EGFP-α1sDHPR-wt transfected (open bars) fibres before and after application of 1 μm isradipine in response to a voltage-clamp pulse to +35 mV. The bars represent the SEM.
Figure 6
Figure 6. Fibres transfected with EGFP-α1sDHPR-T935Y show isradipine-insensitive ICa
A, family of ICa currents elicited by 1 s depolarizing pulses. Traces correspond to depolarization to +5, +10, +15, +20, +25, +30 and +40 mV. The tail currents are shown truncated. Their respective peak values are −48.3, −58.4, −68.3, −84.9, −99.8, −112.7 and −137.6 μA cm−2. ICa recorded in response to a depolarization to +30 mV (indicated by an asterisk) is shown in the inset, together with exponential fits to the activation and decay phases (continuous thin lines). B, voltage dependence of peak total ICa (filled diamonds) and peak ICa-ins (open diamonds). For comparison, the ICaV plot from control fibres (from Fig. 1B) is show with filled circles. C, voltage dependence of gCa calculated from peak total ICa (filled diamonds) and peak ICa-ins (gCa-ins, open diamonds). For comparison, the gCaV plot from fibres (from Fig. 1C) is shown with filled circles. The black and grey continuous lines are the Boltzmann fits to the total gCa and gCa-ins, respectively. Error bars represent the SEM. D, effect of 1 μm isradipine on the ICa recorded from a fibres expressing EGFP-α1sDHPR-T935Y. The black and grey traces are the ICas before (total ICa) and during the application of isradipine (ICa-ins), respectively.
Figure 7
Figure 7. Comparison of the fractional ICa in fibres expressing EGFP-α1sDHPR-T935Y channels with that in a non-mutant group
Average peak ICa recorded before and after application of 1 μm isradipine in response to a voltage-clamp pulse to +35 mV. Fibres expressing EGFP-α1sDHPR-T935Y are represented by the hatched bars. Control, sham-transfected and EGFP-α1sDHPR-wt expressing fibres are pooled together and represented by the filled bars. The bars are the SEM.
Figure 8
Figure 8. Charge movements in control and transfected fibres
A, family of charge movement records from a control fibre. The inset shows a plot of Qonvs.Qoff at various voltages. B and C display charge movement records of fibres transfected with pEGFP-α1sDHPR-wt and pEGFP-α1sDHPR-T935Y. For the records in A, B and C, depolarizing voltage-clamp pulses of 40 to 140 mV (every 20 mV) magnitude were used. For A and B the pulse duration was 25 ms, and for C it was 30 ms. D, Q vs. Vm (QV) plots of average data from control fibres (filled circles) and fibres expressing EGFP-α1sDHPR-wt (open circles) or EGFP-α1sDHPR-T935Y (filled diamonds). The continuous lines are Boltzmann fits to the average data for each fibre type. The error bars are the SEM for each dataset (see Table 3). E, normalized QV plots of the same data in D. Control experiments in sham-transfected fibres yielded values for Qmax, V1/2 and k of 167.3 ± 4.6 nC cm−2, 2.7 ± 1.4 mV and 16.5± 0.8 mV, respectively; these values are not significantly different from those obtained in untransfected fibres.
Figure 9
Figure 9. Ca2+ release in control and transfected fibres
Family of rhod-5N Ca2+ transients from a control fibre (A), a fibre expressing EGFP-α1sDHPR-wt (B) and a fibre expressing EGFP-α1sDHPR-T935Y (C). For the transients in A, B and C, depolarizing voltage clamp pulses of 60, 80, 100, 120 and 160 mV were applied. For A and B, the pulse duration was 25 ms, and for C it was 30 ms. D, ΔF/Fpeakvs. Vm plots of average data from control fibres (filled circles) and fibres expressing EGFP-α1sDHPR-wt (open circles) or EGFP-α1sDHPR-T935Y (filled diamonds). The continuous lines are Boltzmann fits to the average data for each fibre type. The error bars are the SEM for each dataset (see Table 3). The right ordinate axis gives the corresponding peak Ca2+ release flux in μm ms−1 calculated from a single compartment model (see Methods). Control experiments in sham-transfected fibres yielded values for the Ca2+ release parameters that were not significantly different from those obtained in untransfected fibres.
Figure 10
Figure 10. Voltage dependence of pharmacologically separated conductance components in fibres expressing EGFP-α1sDHPR-T935Y
A, filled diamonds, open diamonds and open squares correspond to the gCa values calculated from the total, ICa-ins and ICa-sens components, respectively. Continuous lines are the Boltzmann fits to each component. The values of gCa,max, V1/2 and k for total, isradipine-insensitive and isradipine-sensitive components were: 1.97 ± 0.35, 0.92 ± 0.11 and 1.01 ± 0.27 mS cm−2; 27.9 ± 1.0, 31.1 ± 2.3 and 23.9 ± 0.3 mV; 7.46 ± 0.49, 8.32 ± 0.36 and 5.86 ± 1.01 mV, respectively. B, plots of the gCa components shown in A are displayed normalized by their respective gCa,max values. Bars represent the SEM.

Comment in

  • A shortcut to a skeletal muscle DHPR knock-in?
    Bannister RA, Polster A. Bannister RA, et al. J Physiol. 2011 Oct 1;589(Pt 19):4645-6. doi: 10.1113/jphysiol.2011.216234. J Physiol. 2011. PMID: 21965631 Free PMC article. No abstract available.

References

    1. Adams BA, Beam KG. Muscular dysgenesis in mice: a model system for studying excitation-contraction coupling. FASEB J. 1990;4:2809–2816. - PubMed
    1. Ahern CA, Arikkath J, Vallejo P, Gurnett CA, Powers PA, Campbell KP, Coronado R. Intramembrane charge movements and excitation- contraction coupling expressed by two-domain fragments of the Ca2+ channel. Proc Natl Acad Sci U S A. 2001;98:6935–6940. - PMC - PubMed
    1. Bannister RA, Beam KG. The cardiac α1C subunit can support excitation-triggered Ca2+ entry in dysgenic and dyspedic myotubes. Channels (Austin) 2009;3:268–273. - PMC - PubMed
    1. Beam KG, Knudson CM. Calcium currents in embryonic and neonatal mammalian skeletal muscle. J Gen Physiol. 1988;91:781–798. - PMC - PubMed
    1. Beurg M, Sukhareva M, Strube C, Powers PA, Gregg RG, Coronado R. Recovery of Ca2+ current, charge movements, and Ca2+ transients in myotubes deficient in dihydropyridine receptor β1 subunit transfected with β1 cDNA. Biophys J. 1997;73:807–818. - PMC - PubMed

Publication types

MeSH terms

Substances