. 2011 Feb 14;208(2):341-56.
doi: 10.1084/jem.20101488. Epub 2011 Jan 24.

The malaria circumsporozoite protein has two functional domains, each with distinct roles as sporozoites journey from mosquito to mammalian host

Affiliations

The malaria circumsporozoite protein has two functional domains, each with distinct roles as sporozoites journey from mosquito to mammalian host

Alida Coppi et al. J Exp Med. .

Abstract

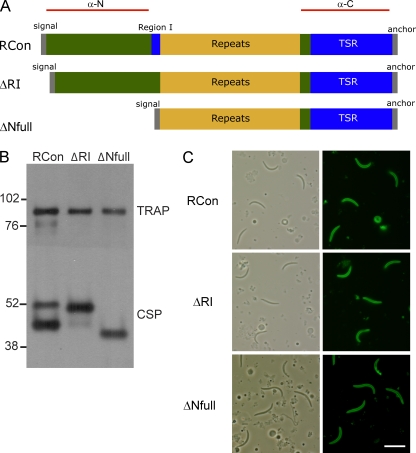
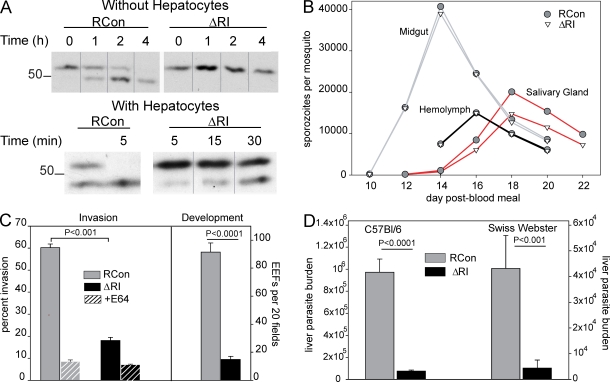
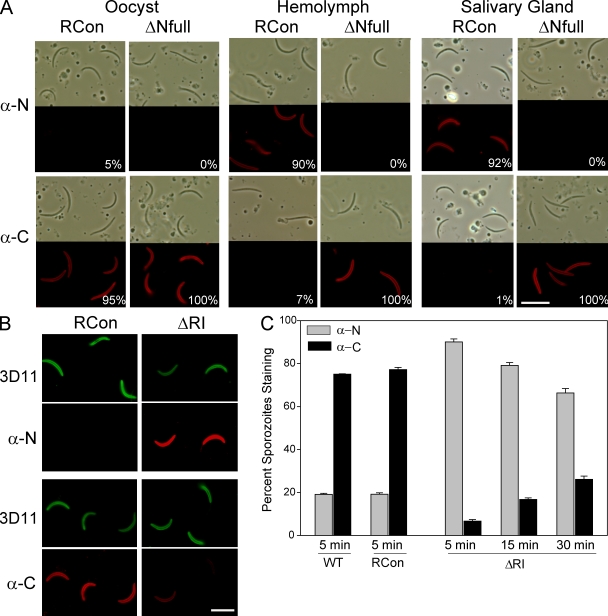
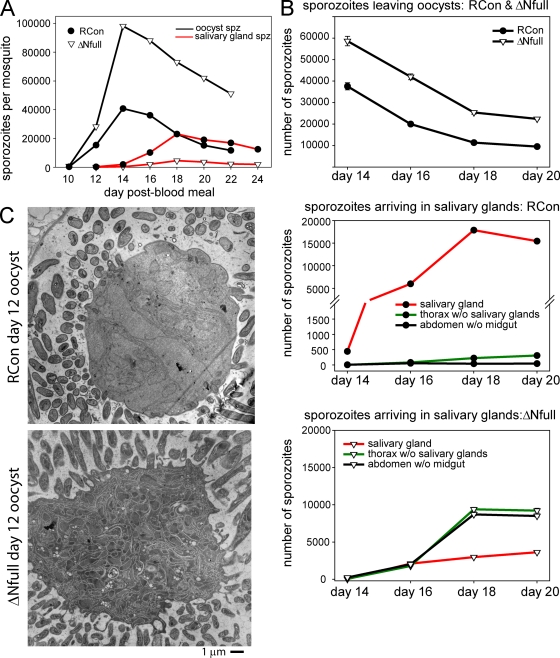
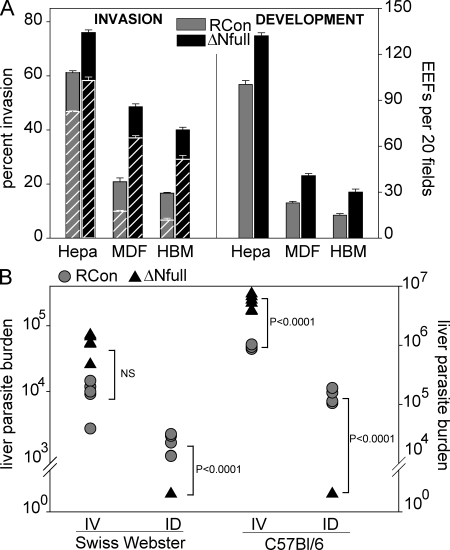
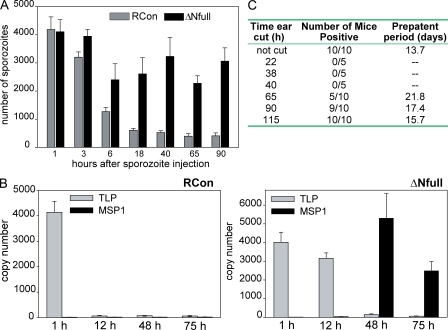
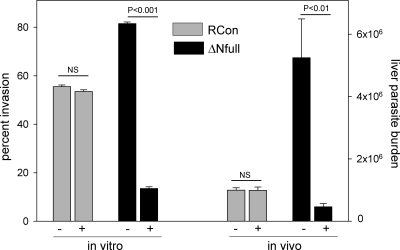
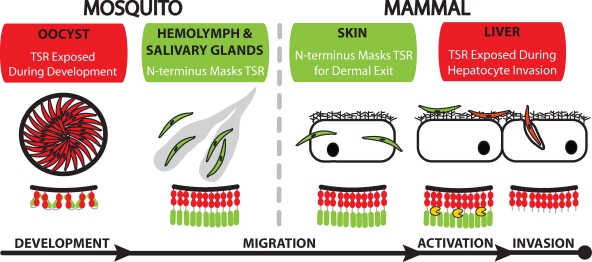
Plasmodium sporozoites make a remarkable journey from the mosquito midgut to the mammalian liver. The sporozoite's major surface protein, circumsporozoite protein (CSP), is a multifunctional protein required for sporozoite development and likely mediates several steps of this journey. In this study, we show that CSP has two conformational states, an adhesive conformation in which the C-terminal cell-adhesive domain is exposed and a nonadhesive conformation in which the N terminus masks this domain. We demonstrate that the cell-adhesive domain functions in sporozoite development and hepatocyte invasion. Between these two events, the sporozoite must travel from the mosquito midgut to the mammalian liver, and N-terminal masking of the cell-adhesive domain maintains the sporozoite in a migratory state. In the mammalian host, proteolytic cleavage of CSP regulates the switch to an adhesive conformation, and the highly conserved region I plays a critical role in this process. If the CSP domain architecture is altered such that the cell-adhesive domain is constitutively exposed, the majority of sporozoites do not reach their target organs, and in the mammalian host, they initiate a blood stage infection directly from the inoculation site. These data provide structure-function information relevant to malaria vaccine development.


Figures

Figure 1.
Figure 1.
CSP mutant parasites. (A) Schematic diagram of CSP expressed in control and mutant parasites. The conserved region I and TSR are shown in blue, the species-specific repeats in yellow, and signal and anchor sequences in gray. Red lines show the length and location of the peptides used to make polyclonal antisera to the N- and C-terminal portions of CSP (α-N and α-C sera, respectively). (B) Western blot analysis of mutant salivary gland sporozoite lysates. The blot was cut in half, and the top was probed with polyclonal antiserum specific for TRAP as a loading control, and the bottom was probed with mAb 3D11 specific for the CSP repeat region. Molecular mass is indicated in kilodaltons. (C) Phase-contrast and fluorescence images of unpermeabilized mutant salivary gland sporozoites stained with mAb 3D11. Bar, 10 µm. Western blots and IFAs were repeated twice with similar results.
Figure 2.
Figure 2.
Phenotype of ΔRI parasites. (A) CSP processing in the absence and presence of hepatocytes. RCon and ΔRI salivary gland sporozoites were metabolically labeled with [35S]Cys/Met and kept on ice (time = 0) or chased for the indicated times after which they were lysed, and CSP was immunoprecipitated and analyzed by SDS-PAGE and autoradiography. For experiments with hepatocytes, labeled sporozoites were chased for 1 h in the absence of cells to give time for labeled CSP to be exported to the parasite surface (first lane for RCon and not depicted for ΔRI) and then added to Hepa1-6 cells for the indicated times, after which samples were processed as outlined above. Thin gray lines between lanes indicate that lanes were not contiguous on the scanned image of the autoradiograph. This experiment was performed three times, and a representative experiment is shown. Molecular mass is indicated in kilodaltons. (B) Sporozoite numbers in the mosquito host. Mosquitoes infected with RCon or ΔRI were dissected on the indicated days after blood meal, and the number of sporozoites associated with mosquito midguts, hemolymph, or salivary glands was determined. 20 mosquitoes were dissected per time point, and shown is the mean number per mosquito. This was repeated with three independent batches of infected mosquitoes, and a representative experiment is shown. (C) Infectivity in vitro. RCon or ΔRI sporozoites were added to Hepa1-6 cells and either fixed for an invasion assay (left) or grown for an additional 2 d before fixing and staining for EEFs (right). For invasion assays, parallel wells were seeded with sporozoites preincubated with E-64d (hatched bars) to determine the percentage of intracellular sporozoites that were in the process of cell traversal. 50 fields per well were counted, and shown are the means ± SD of triplicate wells. Each experiment was repeated three times with similar results. (D) Infectivity in vivo. C57BL/6 and Swiss Webster mice were injected i.v. with 104 RCon or ΔRI sporozoites, and 40 h later, mice were sacrificed, total liver RNA was extracted, and liver parasite burden was determined by RT-qPCR. There are five mice per group, and shown are the means ± SD. Each experiment was performed three times with similar results.
Figure 3.
Figure 3.
Exposure of the C-terminal TSR is a controlled process. (A) Phase-contrast and fluorescence images of oocyst, hemolymph, and salivary gland sporozoites from RCon- and ΔNfull-infected mosquitoes stained with antiserum specific for the CSP N (α-N; top) or C terminus (α-C; bottom). The percentage of 200 sporozoites staining with each respective antiserum is shown. (B) Exposure of the C terminus on RCon and ΔRI sporozoites after contact with hepatocytes. Shown are fluorescence images of RCon and ΔRI salivary gland sporozoites 5 min after addition to Hepa1-6 cells stained with mAb 3D11, which stains all sporozoites (green), and α-N or α-C sera (red). (C) Graph showing the percentage of WT, RCon, or ΔRI salivary gland sporozoites staining with α-N or α-C sera at the indicated time points after their addition to Hepa1-6 cells. Total sporozoite number was determined by staining with mAb 3D11. Shown are the means of triplicate wells ± SD; 100 sporozoites per well were counted. All IFAs were repeated two to three times, and a representative experiment is shown. Bars, 10 µm.
Figure 4.
Figure 4.
Phenotype of ΔNfull sporozoites in the mosquito. (A) Oocyst and salivary gland sporozoite numbers. Mosquitoes infected with RCon or ΔNfull parasites were dissected on the indicated days after blood meal, and the number of sporozoites (spz) associated with midguts or salivary glands was determined. 20 mosquitoes were dissected per time point, and shown is the mean number per mosquito. This was repeated with three independent batches of infected mosquitoes and a representative experiment is shown. (B) Distribution of ΔNfull sporozoites in the mosquito. Mosquitoes infected with RCon or ΔNfull parasites were dissected on the indicated days after blood meal, and midguts, salivary glands, thoraces without salivary glands, and abdomens without midguts were obtained, and the total number of sporozoites associated with each organ was determined by RT-qPCR. Organs from 20 mosquitoes were obtained per time point, and shown is the mean number of RCon and ΔNfull sporozoites associated with the mosquito midgut over time (top), the mean number of RCon sporozoites associated with salivary glands, the thorax, or abdomen over time (middle), and the mean number of ΔNfull sporozoites associated with salivary glands, thorax, or abdomen over time (bottom). The experiment was performed twice with similar results. (C) Transmission electron micrographs of oocysts from mosquitoes infected with RCon or ΔNfull parasites at day 12 after blood meal. Between 8 and 12 oocysts were observed per parasite line, and an average of two sections per oocyst was performed. Shown are representative images.
Figure 5.
Figure 5.
Infectivity of ΔNfull sporozoites in the mammalian host. (A) In vitro infectivity. RCon or ΔNfull sporozoites were added to Hepa1-6 (Hepa), MDFs, or HBMVEC (HBM) for 1 h (invasion), 6 h (PV formation), or 2 d (EEF development), fixed, and stained. Invasion was scored using a double staining assay that distinguishes intracellular from extracellular sporozoites, and shown is the percentage of total sporozoites that are intracellular (left). To determine whether sporozoites entered in a vacuole, replicate wells were fixed 6 h after infection and stained with mAb 3D11 and anti–UIS-4, a marker for the PV, and shown is the percentage of total sporozoites that are in a vacuole (left; hatched bars). In the right panel, the number of EEFs developing for each parasite line is shown. For each experiment, 50 fields per well were counted, and shown are the means ± SD of triplicate wells. The difference in invasion efficiency and EEF development between RCon and ΔNfull sporozoites in all cell lines was significant with p-values <0.01. Experiments were repeated three times with similar results. (B) In vivo infectivity. Mice were injected either i.v. or i.d. with 104 RCon or ΔNfull sporozoites, and 40 h later, total liver RNA was extracted, and liver parasite burden was determined by RT-qPCR. There were five mice per group, and the liver parasite burden of each mouse is shown. The experiment was performed three times with similar results.
Figure 6.
Figure 6.
ΔNfull sporozoites do not exit the dermis and can seed the blood directly from this location. (A) Kinetics with which ΔNfull parasites disappear from the inoculation site. Swiss Webster mice were injected i.d. in the ear with 5,000 RCon or ΔNfull sporozoites, ears were removed at the indicated time points, and the number of sporozoites in each ear was quantified by qPCR. There are four mice per group, and shown are the means ± SD. The differences between RCon and ΔNfull sporozoite numbers remaining in the skin at 18–90 h were statistically significant with p-values <0.001, whereas differences in sporozoite numbers at earlier times points did not reach significance. The experiment was performed twice with similar results. (B) Expression of sporozoite- and EEF-specific genes at the inoculation site. Swiss Webster mice were injected with RCon (left) or ΔNfull (right) sporozoites i.d., ears were removed at the indicated time points, total RNA was extracted, and the expression of TLP and MSP-1 was quantified by RT-qPCR. There were four mice per group, and shown are the means ± SD. (C) Removal of the inoculation site between 22 and 40 h after sporozoite injection abrogates blood stage infection by ΔNfull sporozoites. 104 ΔNfull sporozoites were inoculated i.d. into one ear, and the ear was either left intact or removed at the indicated time points. All mice were followed for 30 d for the appearance of blood stage parasites by Giemsa-stained blood smears. Shown are the combined results of two independent experiments.
Figure 7.
Figure 7.
Just-in-time exposure of the TSR protects sporozoites from antibody-mediated inhibition. The effect of α-C serum on the infectivity of RCon and ΔNfull sporozoites was tested in vitro (left) and in vivo (right). In vitro, sporozoites were added to Hepa1-6 cells in the presence (+) or absence (−) of α-C serum for 1 h, cells were fixed and stained, and the percentage of intracellular sporozoites was determined. 50 fields per well were counted, and shown are the means ± SD of triplicate wells. In vivo, α-C serum (+) or buffer alone (−) was injected i.v. into C57BL/6 mice, and 5 min later, 104 RCon or ΔNfull sporozoites were inoculated i.v., and 40 h later, liver parasite burden was determined by RT-qPCR. There are five mice per group, and shown are the means ± SD. Each experiment was performed three times with similar results.
Figure 8.
Figure 8.
A model for the role of CSP in the sporozoite’s journey. Model showing the correlation between the conformation of CSP on sporozoites and their location/developmental stage in both mosquito and mammalian hosts. Below each heading is a picture of sporozoites in that location, in which green sporozoites have the N terminus exposed and red sporozoites have the C terminus exposed. Below each group of sporozoites is a schematic of CSP, in which green shows the N terminus, red shows the C terminus, gray shows the repeats, and in yellow is the protease that cleaves CSP.

Similar articles

Cited by

References

    1. Adams J.C., Tucker R.P. 2000. The thrombospondin type 1 repeat (TSR) superfamily: diverse proteins with related roles in neuronal development. Dev. Dyn. 218:280–299 10.1002/(SICI)1097-0177(200006)218:2<280::AID-DVDY4>3.0.CO;2-0 - DOI - PubMed
    1. Aley S.B., Bates M.D., Tam J.P., Hollingdale M.R. 1986. Synthetic peptides from the circumsporozoite proteins of Plasmodium falciparum and Plasmodium knowlesi recognize the human hepatoma cell line HepG2-A16 in vitro. J. Exp. Med. 164:1915–1922 10.1084/jem.164.6.1915 - DOI - PMC - PubMed
    1. Amino R., Thiberge S., Martin B., Celli S., Shorte S., Frischknecht F., Ménard R. 2006. Quantitative imaging of Plasmodium transmission from mosquito to mammal. Nat. Med. 12:220–224 10.1038/nm1350 - DOI - PubMed
    1. Amino R., Giovannini D., Thiberge S., Gueirard P., Boisson B., Dubremetz J.F., Prévost M.C., Ishino T., Yuda M., Ménard R. 2008. Host cell traversal is important for progression of the malaria parasite through the dermis to the liver. Cell Host Microbe. 3:88–96 10.1016/j.chom.2007.12.007 - DOI - PubMed
    1. Ballou W.R. 2009. The development of the RTS,S malaria vaccine candidate: challenges and lessons. Parasite Immunol. 31:492–500 10.1111/j.1365-3024.2009.01143.x - DOI - PubMed

Publication types