. 2011 Jan 24;192(2):321-34.
doi: 10.1083/jcb.201006009.

Distinct ECM mechanosensing pathways regulate microtubule dynamics to control endothelial cell branching morphogenesis

Affiliations

Distinct ECM mechanosensing pathways regulate microtubule dynamics to control endothelial cell branching morphogenesis

Kenneth A Myers et al. J Cell Biol. .

Abstract

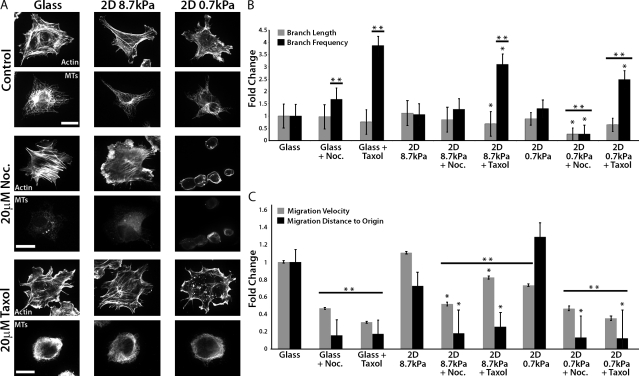
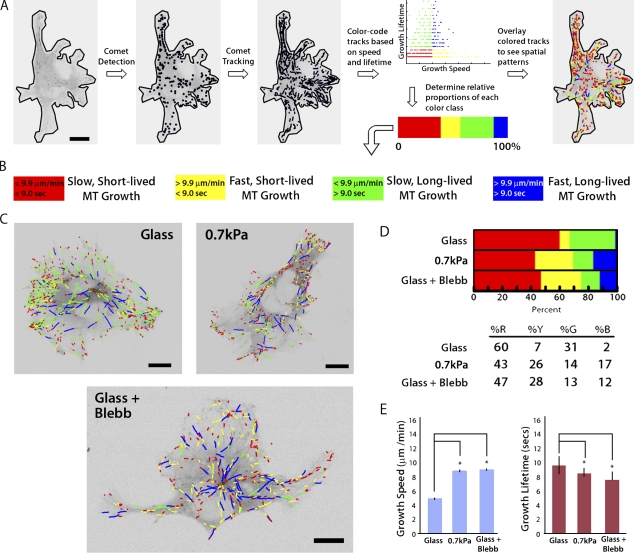
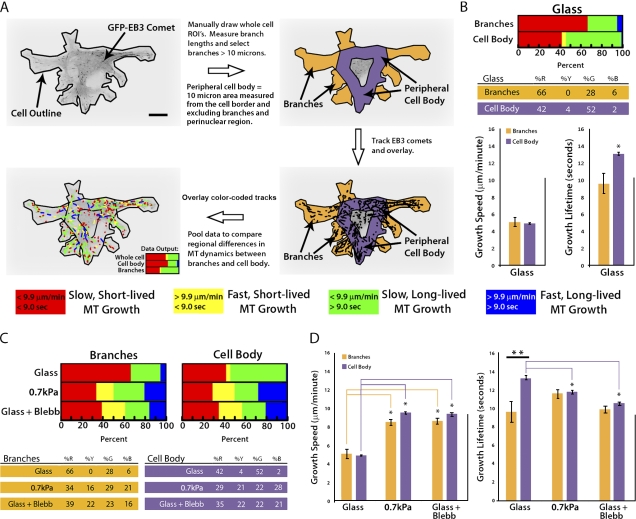
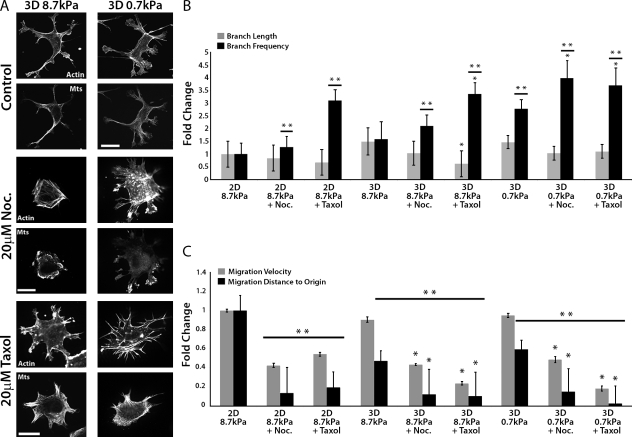
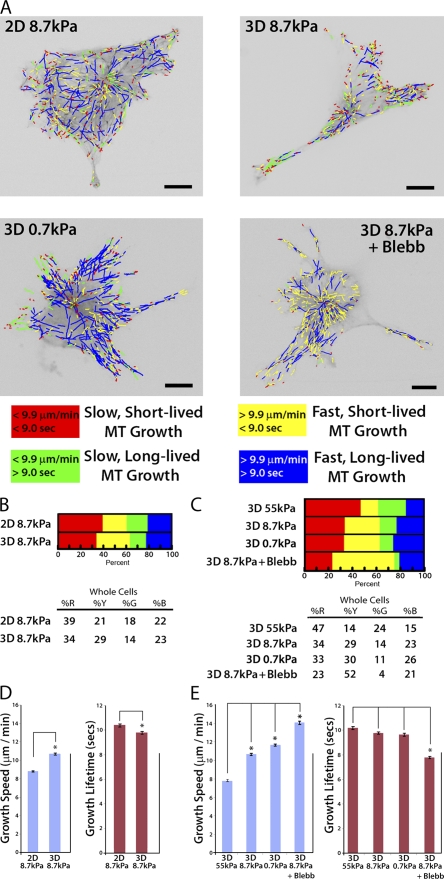
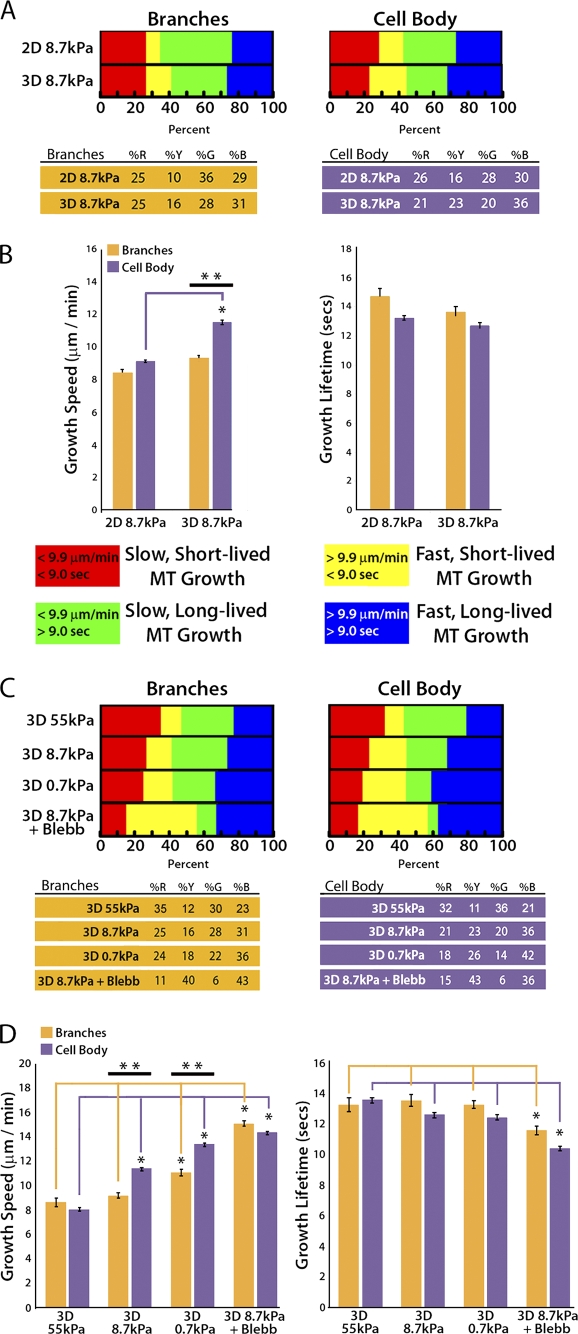
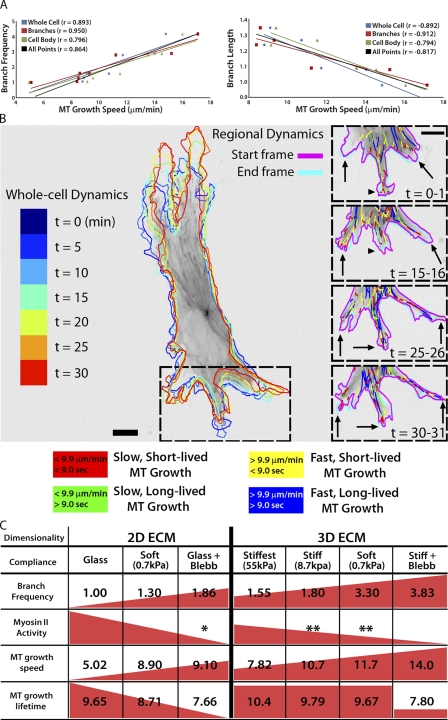
During angiogenesis, cytoskeletal dynamics that mediate endothelial cell branching morphogenesis during vascular guidance are thought to be regulated by physical attributes of the extracellular matrix (ECM) in a process termed mechanosensing. Here, we tested the involvement of microtubules in linking mechanosensing to endothelial cell branching morphogenesis. We used a recently developed microtubule plus end-tracking program to show that specific parameters of microtubule assembly dynamics, growth speed and growth persistence, are globally and regionally modified by, and contribute to, ECM mechanosensing. We demonstrated that engagement of compliant two-dimensional or three-dimensional ECMs induces local differences in microtubule growth speed that require myosin II contractility. Finally, we found that microtubule growth persistence is modulated by myosin II-mediated compliance mechanosensing when cells are cultured on two-dimensional ECMs, whereas three-dimensional ECM engagement makes microtubule growth persistence insensitive to changes in ECM compliance. Thus, compliance and dimensionality ECM mechanosensing pathways independently regulate specific and distinct microtubule dynamics parameters in endothelial cells to guide branching morphogenesis in physically complex ECMs.


Figures

Figure 1.
Figure 1.
Perturbation of MT growth or shortening promotes HUVEC branching and inhibits rapid directional migration. (A) Immunolocalization of MTs and fluorescent phalloidin staining of actin in HUVECs cultured on collagen-coated glass, or stiff (8.7 kPa) or soft (0.7 kPa) compliant ECMs. Samples were treated with DMSO (control), 20 µM nocodazole (Noc.), or 20 µM taxol for 90 min. Bars, 20 µm. (B) Analysis of the effects of the treatments in A on cell branch frequency and length. (C) Analysis of the effects of the treatments in A on cell migration velocity and distance to origin. *, P < 0.05 comparing compliance versus compliance + drug. **, P < 0.05 compared with glass (one-way ANOVA). Error bars indicate standard deviation.
Figure 2.
Figure 2.
Down-regulation of myosin II by compliance mechanosensing promotes fast, short-lived MT growth excursions. (A) Workflow used in the plusTipTracker software package for detecting fluorescent EB3 comets, tracking their movement, and classifying MT growth dynamics based on growth speed and growth lifetime. (B) Color scheme for the four subpopulations of MT growth tracks derived by plusTipTracker software and depicted in C and D. (C) Color-coded MT growth track subpopulation overlays from 2 min time-lapse movies of GFP-EB3 (frame rate = 2 s) on representative cells for comparison between a cell plated on glass with (Glass + Blebb) or without (Glass) 20 µM blebbistatin treatment, or on a more compliant ECM (0.7 kPa). Bars, 10 µm. (D) Percentage of the population of MTs whose dynamics were categorized in the four subpopulations described in B in cells under the conditions described in C. (E) Comparison of percentages of mean MT growth speeds and growth excursion lifetimes in cells under the conditions described in C. *, P < 0.001. Error bars indicate standard error of the mean.
Figure 3.
Figure 3.
Down-regulation of myosin II by compliance mechanosensing promotes fast MT growth globally and short-lived growth excursions in the peripheral cell body. (A) Workflow for categorizing GFP-EB3 comet tracks of MT growth into specific subcellular regions including cell branches and the peripheral cell body. A color code key for the classification of MT growth excursion subpopulations is shown below. Bar, 10 µm. (B) Comparison of percentages (top) of the population of MTs whose growth dynamics were categorized in the four subpopulations described in A, and MT growth speeds and growth excursion lifetimes (bottom) in branch and peripheral cell body regions of cells plated on glass coverslips. (C) Comparison of percentages of the population of MTs whose growth dynamics were categorized in the four subpopulations described in A in branch and peripheral cell body regions. Cells were plated on glass with or without the addition of 20 µM blebbistatin (Glass + Blebb) or on compliant ECMs (0.7 kPa). Percentage values are shown below. (D) Comparison of MT growth speeds (left) and growth excursion lifetimes (right) in branch and peripheral cell body regions of cells plated on glass with or without the addition of 20 µM blebbistatin (Glass + Blebb) or on compliant ECMs (0.7 kPa). **, branches versus cell body; *, between group comparison, P < 0.001. Error bars indicate standard error of the mean.
Figure 4.
Figure 4.
Perturbation of MT growth or shortening affects cell branching and migration similarly in 2D and 3D ECMs. (A) Immunolocalization of MTs and fluorescent phalloidin staining of actin in HUVECs cultured in 8.7 kPa or 0.7 kPa compliant 3D ECMs and treated for 90 min with DMSO vehicle (control), 20 µM nocodazole (Noc.), or 20 µM taxol. Bars, 20 µm. (B) Analysis of the effects of the treatments in A on cell branch frequency and length compared with similar drug treatments of cells plated on 2D 8.7 kPa ECMs. (C) Analysis of the effects of the treatments in A on cell migration velocity and distance to origin compared with similar drug treatments of cells cultured on 2D 8.7 kPa ECMs. *, P < 0.05 comparing compliance versus compliance + drug. **, P < 0.05 compared with 2D 8.7 kPa ECMs (one-way ANOVA). Error bars indicate standard deviation.
Figure 5.
Figure 5.
Compliance mechanosensing promotes fast MT assembly in both 2D and 3D, but 3D ECM engagement makes MT growth persistence insensitive to compliance. (A) Color-coded MT growth track subpopulation overlays from 2-min time-lapse movies of GFP-EB3 (frame rate = 2s) on representative cells cultured on 8.7 kPa or 0.7 kPa 2D ECMs, for comparison with 8.7 kPa or 0.7 kPa 3D ECMs or with cells cultured in 8.7 kPa 3D ECMs and treated with 20 µM blebbistatin (3D 8.7 kPa + Blebb). A color code key for MT growth dynamics classifications is shown below. Bars, 10 µm. (B and C) Comparison of percentages of the population of MTs whose growth dynamics were categorized in the four subpopulations described in A in cells under the conditions described in A or on 55 kPa 3D ECMs. Percentage values shown below. (D and E) Comparison of mean MT growth speeds and growth excursion lifetimes in cells under the conditions described in A or on 55 kPa 3D ECMs. *, P < 0.001. Error bars indicate standard error of the mean.
Figure 6.
Figure 6.
Compliance mechanosensing does not regionally regulate MT growth lifetimes in 3D ECMs. (A) Comparison of percentages of the population of MTs whose growth dynamics are categorized in four subpopulations (key and percentage values are shown below) in cell branch (left) and peripheral cell body (right) regions. (B) Comparison of mean MT growth speeds (left) and growth excursion lifetimes (right) of cells cultured on 2D or in 3D sandwich gels of the same stiffness (8.7 kPa). (C) Comparison of percentages of the population of MTs whose growth dynamics were categorized in the four subpopulations described in A in cell branch (left) and peripheral cell body (right) regions (percentage values are shown below). (D) A comparison of mean MT growth speeds (left) and growth excursion lifetimes (right) of cells cultured in 8.7 kPa 3D sandwich gels with (3D 8.7 kPa + Blebb) or without the addition of 20 µM blebbistatin (3D 8.7 kPa) or in more compliant 3D sandwich gels (3D 0.7 kPa). **, branches versus cell body; *, between group comparison, P < 0.001. Error bars indicate standard error of the mean.
Figure 7.
Figure 7.
MT growth speed is directly correlated with branch frequency and inversely correlated with branch length. (A) Relationships between branch frequency (left; fold increase) or branch length (right; fold increase) and MT growth speed. r, Pearson correlation coefficient. (B, left) Outlines of a HUVEC expressing GFP-EB3 migrating in a 0.7 kPa 3D sandwich gel at 5 min intervals, color-coded by time as shown on the far left. (B, right) Color-coded MT growth track subpopulation overlays from 30-min time-lapse movies of GFP-EB3 (frame rate = 2 s) from the boxed region of selected time points during branching morphogenesis. Arrows, elongating cell branches; arrowheads, retracting cell branch. A color key for MT growth dynamics classifications is shown below. Bar, 10 µm. (C) Summary table depicting data trends (red triangles/squares) for cell branching frequency (fold change) compared with myosin II activity and MT assembly dynamics (mean values) on substrates of varying compliance in 2D and 3D ECMs. (*, Straight et al., 2003; **, Fischer et al., 2009).

References

    1. Beningo K.A., Dembo M., Wang Y.L. 2004. Responses of fibroblasts to anchorage of dorsal extracellular matrix receptors. Proc. Natl. Acad. Sci. USA. 101:18024–18029 10.1073/pnas.0405747102 - DOI - PMC - PubMed
    1. Cukierman E., Pankov R., Yamada K.M. 2002. Cell interactions with three-dimensional matrices. Curr. Opin. Cell Biol. 14:633–639 10.1016/S0955-0674(02)00364-2 - DOI - PubMed
    1. Dehmelt L., Halpain S. 2004. Actin and microtubules in neurite initiation: are MAPs the missing link? J. Neurobiol. 58:18–33 10.1002/neu.10284 - DOI - PubMed
    1. Dehmelt L., Smart F.M., Ozer R.S., Halpain S. 2003. The role of microtubule-associated protein 2c in the reorganization of microtubules and lamellipodia during neurite initiation. J. Neurosci. 23:9479–9490 - PMC - PubMed
    1. Dent E.W., Gertler F.B. 2003. Cytoskeletal dynamics and transport in growth cone motility and axon guidance. Neuron. 40:209–227 10.1016/S0896-6273(03)00633-0 - DOI - PubMed

Publication types