. 2011 Mar 31;117(13):3585-95.
doi: 10.1182/blood-2010-08-301267. Epub 2011 Jan 24.

Chemotherapeutic agents circumvent emergence of dasatinib-resistant BCR-ABL kinase mutations in a precise mouse model of Philadelphia chromosome-positive acute lymphoblastic leukemia

Affiliations

Chemotherapeutic agents circumvent emergence of dasatinib-resistant BCR-ABL kinase mutations in a precise mouse model of Philadelphia chromosome-positive acute lymphoblastic leukemia

Nidal Boulos et al. Blood. .

Abstract

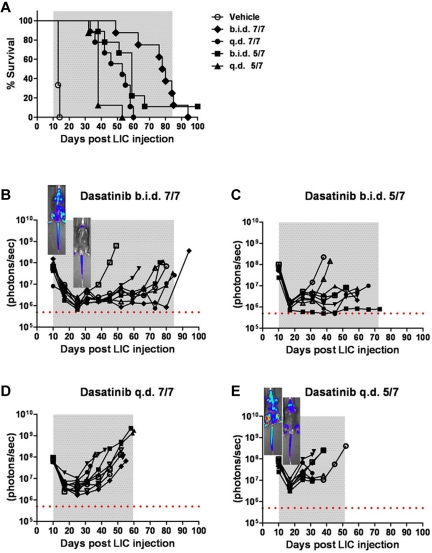
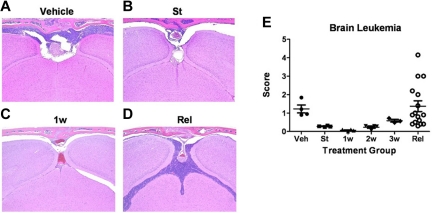
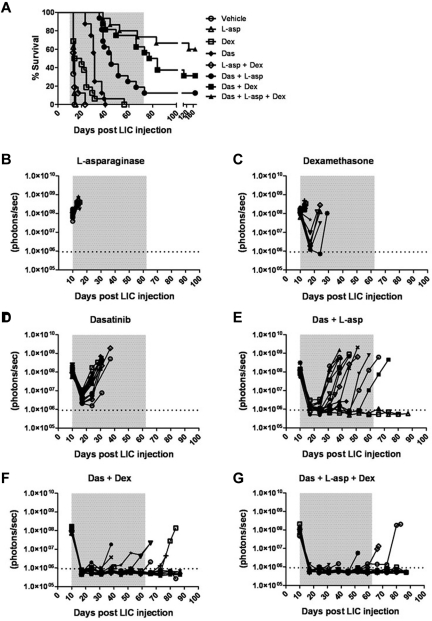
The introduction of cultured p185(BCR-ABL)-expressing (p185+) Arf (-/-) pre-B cells into healthy syngeneic mice induces aggressive acute lymphoblastic leukemia (ALL) that genetically and phenotypically mimics the human disease. We adapted this high-throughput Philadelphia chromosome-positive (Ph(+)) ALL animal model for in vivo luminescent imaging to investigate disease progression, targeted therapeutic response, and ALL relapse in living mice. Mice bearing high leukemic burdens (simulating human Ph(+) ALL at diagnosis) entered remission on maximally intensive, twice-daily dasatinib therapy, but invariably relapsed with disseminated and/or central nervous system disease. Although relapse was frequently accompanied by the eventual appearance of leukemic clones harboring BCR-ABL kinase domain (KD) mutations that confer drug resistance, their clonal emergence required prolonged dasatinib exposure. KD P-loop mutations predominated in mice receiving less intensive therapy, whereas high-dose treatment selected for T315I "gatekeeper" mutations resistant to all 3 Food and Drug Administration-approved BCR-ABL kinase inhibitors. The addition of dexamethasone and/or L-asparaginase to reduced-intensity dasatinib therapy improved long-term survival of the majority of mice that received all 3 drugs. Although non-tumor-cell-autonomous mechanisms can prevent full eradication of dasatinib-refractory ALL in this clinically relevant model, the emergence of resistance to BCR-ABL kinase inhibitors can be effectively circumvented by the addition of "conventional" chemotherapeutic agents with alternate antileukemic mechanisms of action.


Figures

Figure 1
Figure 1
Progression of leukemia after adoptive transfer of LICs. (A) Serial whole-animal luminescent imaging of a representative cohort of recipient mice performed at different times after animals received intravenous injections of 2 × 10⁵ Arf−/−p185+luc+ LICs. Each panel includes a control, disease-free mouse (at far left) imaged under identical experimental conditions. All images are scaled to a maximum intensity of 1 × 10⁶ photons (p)/s/cm2/sr. Rapid increases in bioluminescence signals were noted with disease progression. (B) Randomly selected mice at 3, 7, and 10 days (n = 4 in each group) and at 13 days (n = 10) after injection of luc+ LICs were euthanized, and determinations of white blood counts (WBC), spleen mass, and in vitro luminescence assays of bone marrow (BM) cell suspensions, expressed as relative light units, were performed. The dotted lines at the bottom of each graph represent the upper limits of normal WBC values (left) and spleen masses (middle) for age-matched male C57BL/6J mice, and the lower limit of sensitivity of the in vitro bone marrow cell luminescence assay (right). Median values are represented by solid horizontal lines and standard errors of the mean by brackets.
Figure 2
Figure 2
Dasatinib therapy initiated at different times after leukemia initiation determines response to therapy. Weekly whole-animal luminescent imaging of recipients of 2 × 10⁵ Arf −/−p185+luc+ LICs were acquired over the course of a 4-week dasatinib treatment window (depicted by gray shading in each panel) and thereafter at indicated intervals until clinical relapse or termination of the experiment. Dasatinib therapy was begun in 3 cohorts of recipient mice that had acquired progressively increased leukemic burdens 3 (A), 7 (B), or 10 (C) days after receipt of LICs (Figure 1). Whole-animal luminescent signals (photons/s/cm2/sr) for each recipient mouse are plotted as solid lines that depict image intensity (ordinate) versus time in days after injection of LICs (abscissa). The empirically determined lower limit of sensitivity for whole-animal luminescence, derived from imaging of control nonleukemic animals, is indicated by the dotted line at the bottom of each panel. (D) Kaplan-Meier curves summarizing overall leukemia-free survival in each of the 3 cohorts of mice that received 4 weeks of continuous twice-daily (10 mg/kg/dose) dasatinib therapy.
Figure 3
Figure 3
Dasatinib therapy induces initial responses followed by clinical relapses. (A) Whole-animal luminescent signals (photons/s/cm2/sr) from recipient mice that received 2 × 10⁵ Arf −/−p185+luc+ LICs were acquired at the start (St) of dasatinib therapy 10 days after injection of LICs (n = 36). Serial images were obtained 1 week (1w; n = 37), 2 weeks (2w; n = 31), or 3 weeks (3w; n = 27) after twice-daily (5 days per week) dasatinib therapy or at clinical relapse (Rel; n = 16). For comparison, the imaging signals obtained from moribund, vehicle-treated mice (Veh; n = 4) are also presented. Median values ± standard errors are indicated by horizontal lines and brackets, respectively. (B-E) Quantitative in vitro luminescence intensities plotted as relative light units (RLUs, ordinate) were performed on 100 μL of erythrocyte-free whole blood (B) and 1 × 10⁶ suspended bone marrow (BM) cells (C) prepared from representative mice taken from cohorts depicted in panel A. In situ spleen (D) and cervical lymph node (LN) luminescence signals (E) recorded in photons/second (ordinate) were acquired from intact whole tissues. Four mice were analyzed in each group (except Rel, where n = 15). Values in panels B-E are presented as median ± SE. The empirically determined lower limits of sensitivity are indicated by dotted lines at the bottom of the panels.
Figure 4
Figure 4
Intensity of dasatinib therapy correlates with enhanced survival but fails to provide durable remissions when initiated in mice harboring high leukemic burdens. (A) Kaplan-Meier curves representing the overall survival of 4 cohorts of recipient mice that received 2 × 10⁵ Arf −/−p185+luc+ LICs 10 days before the start of dasatinib therapy (n = 8 per treatment arm). As indicated in the inset legend, mice received vehicle alone, twice-daily dasatinib therapy 7 days per week (b.i.d. 7/7) or 5 days per week (b.i.d. 5/7), or once-daily dasatinib therapy 7 days per week (q.d. 7/7) or 5 days per week (q.d. 5/7). (B-E) Ten days after LIC inoculation, mice in each cohort evidenced similar degrees of advanced disease as determined by image signal intensities. Whole-animal luminescent signals (photons/s/cm2/sr) for individual recipient mice are plotted as solid lines that depict image intensity (ordinate) versus time in days after injection of LICs (abscissa). The empirically determined lower limit of sensitivity for whole-animal luminescence is indicated by the dotted horizontal line at the bottom of each panel. Therapy was continued throughout the intervals designated by gray shading. Representative inset images reveal localized disease in the neck area (cervical lymph nodes) in the twice-daily 7/7 treatment group (B), in contrast to the disseminated disease including the hind limbs (bone marrow compartment) in the once-daily 5/7 cohort (E).
Figure 5
Figure 5
Leukemia-cell infiltration into the brain. (A-D) Formalin-fixed, decalcified, paraffin-embedded sections from the heads of mice were stained with hematoxylin and eosin and examined for the presence of leukemic infiltration of meninges, brain parenchyma, and bone marrow within the overlying calvaria. (A) Coronal sections from moribund, vehicle-treated mice 13 days after receipt of LICs showed characteristically high levels of leukemic-cell infiltration into the meningeal layer associated with filling of bone marrow space in overlying calvaria. (B) At the start (St) of dasatinib therapy 10 days after LIC injection, recipients typically harbored detectable leukemic infiltrates in the meninges. (C) Infiltrates decreased significantly after 1 week (1w) of dasatinib therapy. (D) Significant leukemic expansion was observed in all mice that ultimately relapsed despite continuous dasatinib therapy. (E) Leukemia infiltration of the CNS of recipients was reviewed and scored by a blinded veterinary pathologist from mice at the start of dasatinib therapy (St; n = 4); after 1 week (1w; n = 4), 2 weeks (2w; n = 4), or 3 weeks (3w; n = 4) of twice-daily (5 days per week) dasatinib therapy; or at clinical relapse (Rel; n = 15). This panel depicts the leukemic infiltration score in mice at the indicated times; scores represent the thickest portion of lymphocyte infiltration of all sections reviewed and are expressed in micrometers.
Figure 6
Figure 6
Dexamethasone and L-asparaginase therapy prolongs dasatinib-induced remissions and enhances survival of leukemic mice. (A) Kaplan-Meier curves summarizing the overall survival of cohorts of leukemic mice receiving vehicle alone, single agents, or different drug combinations (as indicated in the inset panel). Each treatment arm included 16 mice. Therapies were initiated 10 days after mice received 2 × 10⁵ LICs. The addition of L-asparaginase (L-asp), dexamethasone (Dex), or both to dasatinib (Das) therapy significantly prolonged median survival of recipients (P values in text), and was associated with long-term survival of 13% (n = 2), 31% (n = 5), and 56% (n = 9) of mice in these respective treatment groups. (B-G) Whole-animal luminescent signals (photons/s/cm2/sr) from individual leukemic mice were serially acquired to monitor therapeutic responses and subsequent relapses. In all graphs, signals from individual recipient mice are plotted as solid lines that depict imaging intensity (ordinate) versus time in days after injection of LICs (abscissa). The empirically determined lower limit of sensitivity for whole-animal luminescence is indicated by the dotted horizontal line at the bottom of each graph, and the indicated treatment periods for single or multiple agents are shaded in gray.

References

    1. Wong S, Witte ON. The BCR-ABL story: bench to bedside and back. Annu Rev Immunol. 2004;22:247–306. - PubMed
    1. Mullighan CG, Miller CB, Radtke I, et al. BCR-ABL1 lymphoblastic leukaemia is characterized by the deletion of Ikaros. Nature. 2008;453(7191):110–114. - PubMed
    1. Mullighan CG, Williams RT, Downing JR, Sherr CJ. Failure of CDKN2A/B (INK4A/B-ARF)-mediated tumor suppression and resistance to targeted therapy in acute lymphoblastic leukemia induced by BCR-ABL. Genes Dev. 2008;22(11):1411–1415. - PMC - PubMed
    1. Trageser D, Iacobucci I, Nahar R, et al. Pre-b-cell receptor-mediated cell cycle arrest in Philadelphia chromosome-positive acute lymphoblastic leukemia requires IKAROS function. J Exp Med. 2009;206(8):1739–1753. - PMC - PubMed
    1. Druker BJ, Talpaz M, Resta DJ, et al. Efficacy and safety of a specific inhibitor of the BCR-ABL tyrosine kinase in chronic myeloid leukemia. N Engl J Med. 2001;344(14):1031–1037. - PubMed

Publication types

MeSH terms