. 2011 Mar 24;117(12):3286-93.
doi: 10.1182/blood-2010-01-266742. Epub 2011 Jan 24.

FLT3 ligand impedes the efficacy of FLT3 inhibitors in vitro and in vivo

Affiliations

FLT3 ligand impedes the efficacy of FLT3 inhibitors in vitro and in vivo

Takashi Sato et al. Blood. .

Abstract

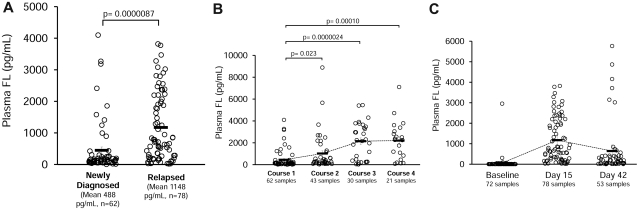
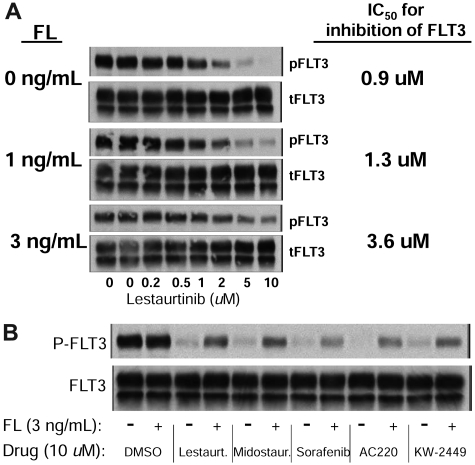
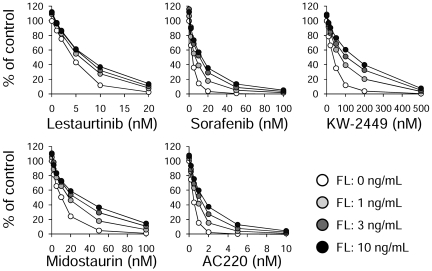
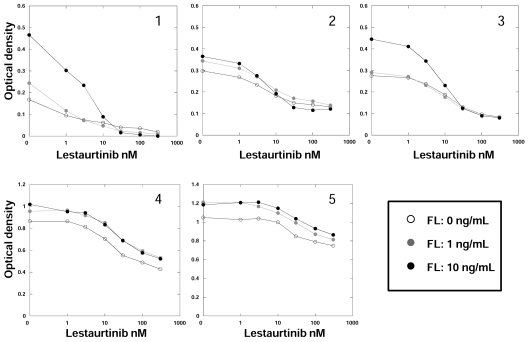
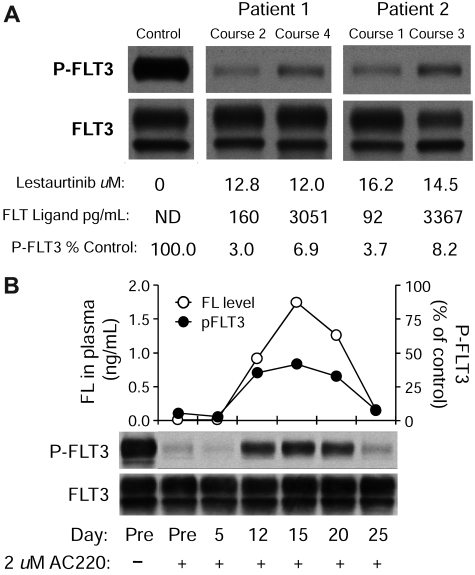
We examined in vivo FLT3 inhibition in acute myeloid leukemia patients treated with chemotherapy followed by the FLT3 inhibitor lestaurtinib, comparing newly diagnosed acute myeloid leukemia patients with relapsed patients. Because we noted that in vivo FLT3 inhibition by lestaurtinib was less effective in the relapsed patients compared with the newly diagnosed patients, we investigated whether plasma FLT3 ligand (FL) levels could influence the efficacy of FLT3 inhibition in these patients. After intensive chemotherapy, FL levels rose to a mean of 488 pg/mL on day 15 of induction therapy for newly diagnosed patients, whereas they rose to a mean of 1148 pg/mL in the relapsed patients. FL levels rose even higher with successive courses of chemotherapy, to a mean of 3251 pg/mL after the fourth course. In vitro, exogenous FL at concentrations similar to those observed in patients mitigated FLT3 inhibition and cytotoxicity for each of 5 different FLT3 inhibitors (lestaurtinib, midostaurin, sorafenib, KW-2449, and AC220). The dramatic increase in FL level after chemotherapy represents a possible obstacle to inhibiting FLT3 in this clinical setting. These findings could have important implications regarding the design and outcome of trials of FLT3 inhibitors and furthermore suggest a rationale for targeting FL as a therapeutic strategy.


Figures

Figure 1
Figure 1
Plasma FL levels from clinical trial patients. (A) Plasma samples obtained on day 15 of induction therapy for newly diagnosed (left) versus relapsed (right) FLT3 mutant AML patients were assayed for FL by enzyme-linked immunosorbent assay. (B) FL levels from plasma samples obtained from newly diagnosed FLT3 mutant AML patients. Course 1 was induction; and courses 2-4 were consolidation. The course 1 samples correspond to the samples on the left in panel A. For course 1, the mean FL concentration was 488 pg/mL (range, 3-4099 pg/mL); for course 2, the mean was 1196 pg/mL (range, 34-8889 pg/mL); for course 3, the mean was 2298 pg/mL (range, 30-5451 pg/mL); for course 4, the mean was 2145 pg/mL (range, 76-7108 pg/mL). (C) FL plasma levels from individual patients on the Cephalon 204 trial at 3 different time points during therapy. For the baseline samples, there was a single sample measuring 2953 pg/mL. Twenty-two baseline samples had FL levels below the limit of detection for the assay (eg, < 2 pg/mL). These samples were listed as having 2 pg/mL. For the baseline samples, the median was 5 pg/mL, the mean was 57 pg/mL, and the range was from undetectable to 2298 pg/mL. For the day 15 samples, the mean was 1173 pg/mL, the median was 721 pg/mL, and the range was 19 to 3818 pg/mL. For the day 42 samples, the median was 187 pg/mL, the mean was 642 pg/mL, and the range was 4 to 5767 pg/mL.
Figure 2
Figure 2
FL impairs inhibition of FLT3 autophosphorylation in vitro. (A) Molm14 cells were exposed to increasing concentrations of lestaurtinib in the presence of 0, 1, and 3 ng/mL of FL in plasma for 2 hours. FLT3 autophosphorylation was then evaluated by immunoblotting (gels, left) by immunoprecipitating FLT3, and then, after electrophoresis and transfer to membrane, probing with antiphosphotyrosine. The bands were analyzed by densitometry and plotted (graph, right). (B) Molm14 cells were incubated in plasma with 10μM of the indicated drug and 0 ng/mL (−) or 3 ng/mL (+) of FL for 2 hours. FLT3 autophosphorylation was then evaluated by immunoblotting.
Figure 3
Figure 3
FL impairs the cytotoxic effects of FLT3 inhibitors. Molm14 cells were incubated in cell culture medium (RPMI with 10% fetal bovine serum) with increasing concentrations of the indicated drugs for 48 hours in the presence of 0, 1, 3, and 10 ng/mL of FL. Cell viability was then determined using the MTT assay. Results are plotted as percentage DMSO control.
Figure 4
Figure 4
FL impairs the cytotoxic effects of FLT3 inhibitors in primary AML samples. Five different primary AML blast samples, each harboring a FLT3/ITD mutation, were incubated in culture medium with increasing concentrations of the indicated drugs for 48 hours in the presence of FL, as in Figure 3. Cell viability was then determined using the MTT assay. Results are plotted as percentage DMSO control. Each point represents the average of quadruplicate optical density measurements. The error bars were omitted for figure clarity but, for each point, amounted to < 5% of the optical density value.
Figure 5
Figure 5
FL impairs inhibition of FLT3 autophosphorylation in vivo. (A) Plasma samples from 2 individual patients treated on the MRC AML15 trial were collected at different time points and then assessed for FLT3 inhibitory activity (PIA assay). Cells were exposed to the plasma for 3 hours and then lysed. FLT3 was immunoprecipitated, subjected to electrophoresis, and transferred to a membrane. The blot was probed with antiphosphotyrosine (top row), then stripped and reprobed with anti-FLT3 (bottom row). FL and lestaurtinib levels were determined from the same plasma samples as described in “FL ELISA” and “Pharmacokinetics.” (B) Plasma was collected from a single newly diagnosed AML patient at different time points after diagnosis and treatment with induction chemotherapy (cytarabine, daunorubicin, and etoposide). The plasma was assayed for FL levels by enzyme-linked immunosorbent assay and plotted (○). In parallel, AC220 was added to a concentration of 2μM for each time point and used to incubate Molm14 cells for 2 hours. Each sample was then assayed for FLT3 inhibitory activity as in panel A. The densitometric analysis of the phospho-FLT3 blot (top blot; ●).

Comment in

References

    1. Gilliland DG, Griffin JD. The roles of FLT3 in hematopoiesis and leukemia. Blood. 2002;100(5):1532–1542. - PubMed
    1. Levis M, Small D. FLT3: ITDoes matter in leukemia. Leukemia. 2003;17(9):1738–1752. - PubMed
    1. Levis M, Small D. FLT3 tyrosine kinase inhibitors. Int J Hematol. 2005;82(2):100–107. - PubMed
    1. Pratz K, Levis M. Incorporating FLT3 inhibitors into acute myeloid leukemia treatment regimens. Leuk Lymphoma. 2008;49(5):852–863. - PMC - PubMed
    1. Zeng Z, Shi YX, Samudio IJ, et al. Targeting the leukemia microenvironment by CXCR4 inhibition overcomes resistance to kinase inhibitors and chemotherapy in AML. Blood. 2009;113(24):6215–6224. - PMC - PubMed

Publication types

MeSH terms