. 2011 May 5;117(18):4924-34.
doi: 10.1182/blood-2010-10-313676. Epub 2011 Jan 24.

Single-lineage transcriptome analysis reveals key regulatory pathways in primitive erythroid progenitors in the mouse embryo

Affiliations

Single-lineage transcriptome analysis reveals key regulatory pathways in primitive erythroid progenitors in the mouse embryo

Joan Isern et al. Blood. .

Abstract

Primitive erythroid (EryP) progenitors are the first cell type specified from the mesoderm late in gastrulation. We used a transgenic reporter to image and purify the earliest blood progenitors and their descendants from developing mouse embryos. EryP progenitors exhibited remarkable proliferative capacity in the yolk sac immediately before the onset of circulation, when these cells comprise nearly half of all cells of the embryo. Global expression profiles generated at 24-hour intervals from embryonic day 7.5 through 2.5 revealed 2 abrupt changes in transcript diversity that coincided with the entry of EryPs into the circulation and with their late maturation and enucleation, respectively. These changes were paralleled by the expression of critical regulatory factors. Experiments designed to test predictions from these data demonstrated that the Wnt-signaling pathway is active in EryP progenitors, which display an aerobic glycolytic profile and the numbers of which are regulated by transforming growth factor-β1 and hypoxia. This is the first transcriptome assembled for a single hematopoietic lineage of the embryo over the course of its differentiation.


Figures

Figure 1
Figure 1
GFP expression from the ϵ-globin::H2B-EGFP transgene marks the primitive erythroid lineage in the blood islands of the YS and can be used to identify and isolate EryP progenitors. (A) GFP expression in ϵ-globin::H2B-EGFP primitive streak to early somite–stage transgenic embryos. To visualize the emergence and expansion of GFP(+) EryP cells, time-lapse videos of cultured ϵ-globin::H2B-EGFP embryos were acquired. GFP(+) cells appear in a narrow band of 3-5 cell diameters in the proximal YS during mid-to-late gastrulation (MS/LS stage). Scale bar, 500 μm. MS, midstreak; LS, late streak; EB, early bud; LHF, late headfold; ss, somite stage; ESom, early somite. (B) Selected snapshots from time-lapse video (supplemental Video 1) of an ϵ-globin::H2B-EGFP embryo cultured in vitro under physiologic conditions from the LS to the ESom stage. Early-bud-stage embryos were imaged over a period of 14 hours, from the time before transgene induction (∼ EB, t = 0) through the ESom stages (t = 860 minutes; supplemental Video 1). Confocal images were acquired as sequential optical x-y sections taken at 4-μm z intervals. Images were taken at 20-minute intervals (total imaging time: 14.5 hours). (C) Flow cytometric histogram profiles of dispersed ϵ-globin::H2B-EGFP transgenic embryos reveals a clearly identifiable GFP(+) population. (D) Cells from whole E7.5 or E8.5 embryos were FACS sorted to GFP(+) and GFP(−) populations. Left panel, Giemsa-stained cytospun cells from FACS sort. Scale bar, 20 μm. EryP-progenitor numbers were measured using a clonogenic assay. Virtually all progenitor activity was recovered in the GFP(+) population. Characteristic EryP colonies (right panels) showed red pigmentation (hemoglobin) and GFP fluorescence. Scale bar, 50 μm. (E) Real-time RT-PCR expression of endogenous embryonic ϵy- and βh1-globin genes in GFP(+) and GFP(−) FACS-sorted cells from E7.5 ϵ-globin::H2B-EGFP transgenic embryos. Expression was normalized to ubiquitin b (Ubb). (F) EryP numbers at the YS stages of development.
Figure 2
Figure 2
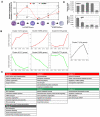
Global gene expression profiling of the primitive erythroid lineage. Labeled cRNA samples were hybridized to Illumina Mouse WG-6 v1.1 Expression BeadChip genome-wide arrays. Quality control of array data was performed using the Bioconductor lumi R package. The filtered genes were clustered into 7 major patterns using the maSigPro algorithm. We were able to survey a genome-wide probe set representing 46 630 murine transcripts, encompassing the emergence of EryP progenitors in the YS through successive stages of erythroblast differentiation in the circulation. Many of these probes target less well-annotated transcripts or transcript isoforms of known genes. There are 21 174 unique genes in the University of California-Santa Cruz mouse mm9 refseq protein coding gene database, and the Illumina mouse-6 v1.1 microarray used in this study contains probes for 18 970 or 89.6% of the well-annotated refseq mouse genes. Analyses were performed using all probes with Entrez ID annotations found with the lumiMouseAll.db version 1.6.1 annotation package. (A) Changes (increased or decreased) in transcript numbers during consecutive stages of EryP development. The graph represents the total numbers of transcripts showing a change of greater than 2-fold (P < .01). Dotted red line indicates increasing expression; dotted gray line indicates decreasing expression. Peaks in transcription variation were identified during the windows from E8.5-E9.5 (transition from the YS to the circulation stage, 273 transcripts) and from E11.5-E12.5 (fetal liver stage, 351 transcripts). (B) Plot representations of 7 specific clusters of transcripts with similar temporal expression patterns. Clusters were subclassified into 3 groups, representing genes that are progressively up-regulated (clusters 1, 2, and 3, red lines); down-regulated (clusters 4, 5, and 6, green lines); or up-regulated through E11.5 and then down-regulated rapidly over the next 24 hours of development (gray line, cluster 7). The peaks in transcription variation indicated in panel A are especially evident in clusters 1, 4, and 7 (relatively sharp increases or decreases in expression, E8.5-E9.5, corresponding to the transition from the YS to the circulation stage) and in clusters 3, 6, and 7 (abrupt increases or decreases in expression, E11.5-E12.5, corresponding to fetal liver stage, when EryP complete their maturation and enucleate). Each individual point (○) represents the mean gene expression of the cluster genes from one microarray experiment. Each line connects mean values for all replicates. (C) Overrepresented gene ontologies for the clusters shown in panel A. (D) Expression of a representative gene that is up-regulated (Gata1) and one that is down-regulated (Igf2) in the EryP microarray dataset, analyzed using qRT-PCR. Expression levels were normalized relative to ubiquitin b (Ubb).
Figure 3
Figure 3
Molecular signatures of EryP progenitors. (A) Hemangioblastic marker expression by early EryPs. FACS plots showing expression of Flk-1 and VE-cadherin surface protein in GFP(+) cells from ϵ-globin::H2B-EGFP embryos at E7.5 and E8.5. (B) Selected genes that are activated during EryP progenitor expansion from E7.5-E8.5. Transcripts listed showed a low adjusted P value and median expression level < 9.5 (log2 scale) for triplicates at E7.5 and were up-regulated ≥ 3.5-fold by E8.5. Samples were amplified before hybridization to the microarray. Expression cutoff, 7.2. (C) Expression of activated β-catenin (*β-cat) in EryP at E8.0. Cells from dispersed E8.0 ϵ-globin::H2B-EGFP embryos were cytocentrifuged onto slides and then immunostained. (D-E) Expression of a TCF/Lef::H2B-GFP transgenic reporter for the canonical Wnt-signaling pathway in an ∼ E7.75 embryo. (D) Anterior view of late headfold (LHF) stage TCF/Lef::H2B-GFP embryo counterstained with Hoechst to highlight nuclei. The image is a 3D reconstruction of a z-stack and was acquired using a Zeiss LSM 510 microscope outfitted with a plan-apochromat 20×/0.75 NA lens. White box indicates the blood islands of the YS. Scale bar, 100 μm. (E) High-magnification view of the boxed region in panel D. Scale bar, 50 μm.
Figure 4
Figure 4
Changes in gene and protein expression during the transition of EryPs from the YS to the embryonic circulation. (A) Gene identifiers of EryP progenitors. Transcripts expressed by E8.5 EryPs are grouped into functional categories. The fold change from E8.5 and E9.5 is shown. Positive value, up-regulated; negative value, down-regulated. (B) FACS profiles of CD41 protein expression on ϵ-globin::H2B-EGFP embryos from E7.5-E9.5. Expression increases from E7.5-E8.5 and then declines by E9.5. Expression is undetectable at later stages (not shown). (C) FACS histograms showing down-regulation of adhesion molecules on ϵ-globin::H2B-EGFP EryPs during the transition from the YS stage to the circulation.
Figure 5
Figure 5
Growth factor and cytokine pathways in primitive erythroid progenitors. (A) Changes in expression of genes encoding growth factor or cytokine receptors and downstream signaling components in E7.5 and E8.5 EryPs. Shown in this table are median expression levels (log2) from the microarray and linear fold change in expression. (B) Effect of TGF-β1 on formation of EryP progenitors. EryPs were FACS sorted from whole E8.5 embryos and plated in the methylcellulose colony assays in the presence of the indicated concentrations of TGF-β1. Data represent the average of triplicate samples from 4 experiments; error bars represent SEM. (C) Expression of c-kit and Tie-2 protein on EryP at E7.5, E8.5, and E9.5. (D) c-kit marks EryP progenitors within the GFP(+) cell population from E8.5 embryos. Cells were FACS sorted and plated in triplicate in methylcellulose progenitor assays. Colonies were scored at day 5. One representative experiment of 3 is shown; error bars represent SEM (E) Tie-2 marks EryP progenitors within the GFP(+) cell population from E8.5 embryos. Cells were FACS sorted and plated in triplicate in methylcellulose progenitor assays. Colonies were scored at day 5. One representative experiment of 3 is shown; error bars represent SEM (F) Real-time RT-PCR analysis of mRNA expression of Tgf1, Ang-1, Scf, and Epo in FACS-sorted EryPs, visceral endoderm, and endothelial cells from YS or in cells from whole embryos at E8.5. Expression levels are shown relative to Ubb.
Figure 6
Figure 6
Hypoxia regulates EryP-progenitor activity. (A) Expression of genes involved in glucose metabolism during EryP maturation. Relative mRNA levels from the microarrays expressed on a log2 scale. Note the isoform switching from Pgk1 to Pklr. (B) Transcripts known to be induced by hypoxia are down-regulated during EryP maturation. Absolute expression (log2 scale) and fold change in expression are shown for the period from E8.5-E11.5. Expression cutoff, 6.0. (C) Hypoxia increases EryP-progenitor numbers in culture. E8.5 EryPs were FACS sorted, plated in methylcellulose, and incubated under atmospheric or low-oxygen (5%) conditions. Total EryP colony numbers were scored at day 5. (D) Increase in EryP colony size under low-oxygen conditions. Photographs of representative EryP colonies grown at atmospheric or low oxygen conditions are shown. Scale bar, 50 μm. The graph displays the mean radius of EryP colonies (day 4) grown at atmospheric or low oxygen. The EryP colonies that formed in low oxygen were significantly larger than those formed at atmospheric oxygen (33 vs 23.3 μm mean colony radius, respectively). (E) Giemsa staining of cytocentrifuged cells from EryP colonies grown at atmospheric or low oxygen and harvested at day 4. Scale bar, 50 μm. (F) Expression of hypoxia-regulated genes in EryP colonies grown at atmospheric or low oxygen. Colonies were harvested at day 4 and RNA was prepared for qRT-PCR analysis. Expression levels are shown relative to Ubb. Cells grown under hypoxic conditions maintain higher-level expression of these genes than cells grown at atmospheric oxygen. These genes are normally down-regulated as EryP progenitors mature (panel A).

Comment in

References

    1. Kinder SJ, Tsang TE, Quinlan GA, Hadjantonakis AK, Nagy A, Tam PP. The orderly allocation of mesodermal cells to the extraembryonic structures and the anteroposterior axis during gastrulation of the mouse embryo. Development. 1999;126(21):4691–4701. - PubMed
    1. Haar JL, Ackerman GA. A phase and electron microscopic study of vasculogenesis and erythropoiesis in the yolk sac of the mouse. Anat Rec. 1971;170(2):199–223. - PubMed
    1. Wong PM, Chung SW, Reicheld SM, Chui DH. Hemoglobin switching during murine embryonic development: evidence for two populations of embryonic erythropoietic progenitor cells. Blood. 1986;67(3):716–721. - PubMed
    1. Palis J, Robertson S, Kennedy M, Wall C, Keller G. Development of erythroid and myeloid progenitors in the yolk sac and embryo proper of the mouse. Development. 1999;126(22):5073–5084. - PubMed
    1. Lucitti JL, Jones EA, Huang C, Chen J, Fraser SE, Dickinson ME. Vascular remodeling of the mouse yolk sac requires hemodynamic force. Development. 2007;134(18):3317–3326. - PMC - PubMed

Publication types

MeSH terms