

doi: 10.1364/OL.36.000139.
Fast voice-coil scanning optical-resolution photoacoustic microscopy
Affiliations
- PMID: 21263479
- PMCID: PMC3086411
- DOI: 10.1364/OL.36.000139
Item in Clipboard
Fast voice-coil scanning optical-resolution photoacoustic microscopy
Opt Lett.
.
Abstract
We developed a photoacoustic imaging system that has real-time imaging capability with optical resolution. The imaging system is capable of scanning at 20 Hz over a 9 mm range and up to 40 Hz over a 1 mm scanning range. A focused laser beam provides a lateral resolution of 3.4 μm as measured in an optically nonscattering medium. Flows of micrometer-sized carbon particles or whole blood in a silicone tube and individual red blood cells (RBCs) in mouse ear capillaries were also imaged in real time, demonstrating the capability to image highly dynamic processes in vivo at a micrometer-scale resolution.
Figures
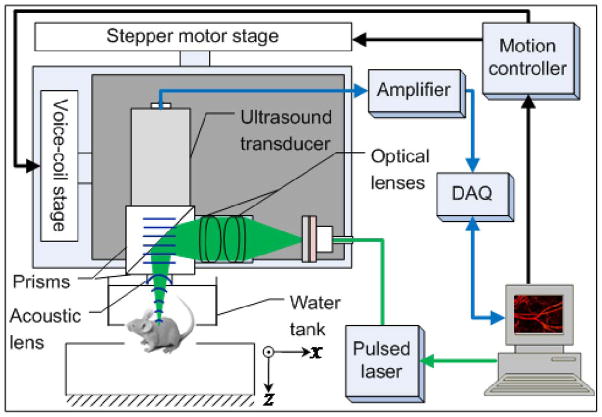
Schematic of voice-coil-driven fast-scanning OR-PAM.
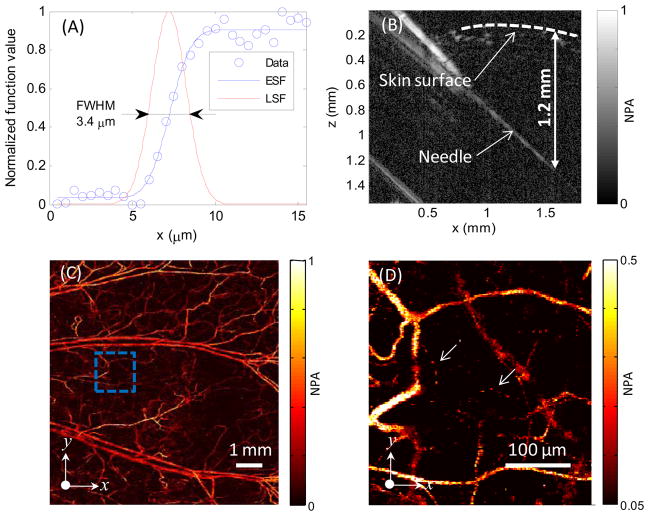
(A) Lateral resolution test on a sharp edge. ESF, edge spread function; LSF, line spread function. (B) Test of penetration depth by imaging a needle obliquely inserted into biological tissue. (C) In vivo maximum amplitude projection (MAP) image of mouse ear vasculature. (D) Close-up of the region enclosed by the dashed box in (C); arrows denote capillaries. NPA, normalized photoacoustic amplitude.
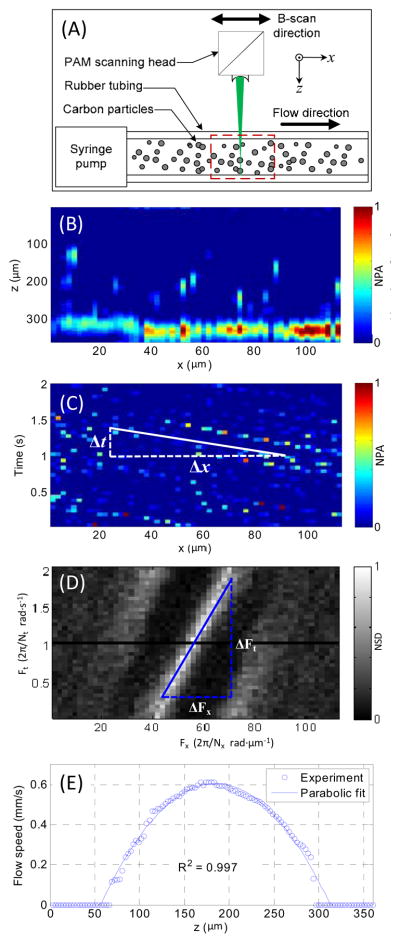
(A) Schematic of the experiment setup for carbon particle flow measurement. (B) Representative B-scan flow image across the dashed-box area in Fig. 3(A). (C) Distribution of imaged carbon particles along the x-axis at one z-axis position versus time. (D) Frequency spectrum of data in Fig. 3(C) obtained with two-dimensional Fourier transformation. (E) Imaged parabolic flow speed along the z-axis. NPA, normalized photoacoustic amplitude; NSD, normalized spectrum density.
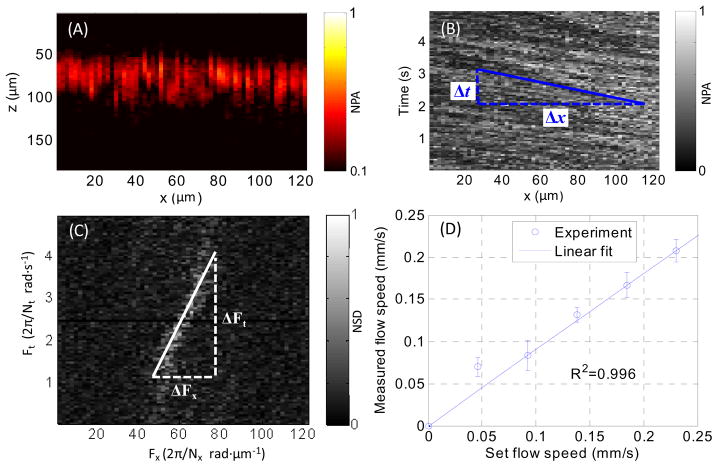
(A) B-scan image of whole blood flowing in a tube. (B) MAP along the z-axis of the B-scan image versus time. (C) Two-dimensional frequency spectrum of the data in Fig. 4(B). (D) Measured flow speed versus the preset values. NPA, normalized photoacoustic amplitude; NSD, normalized spectrum density.
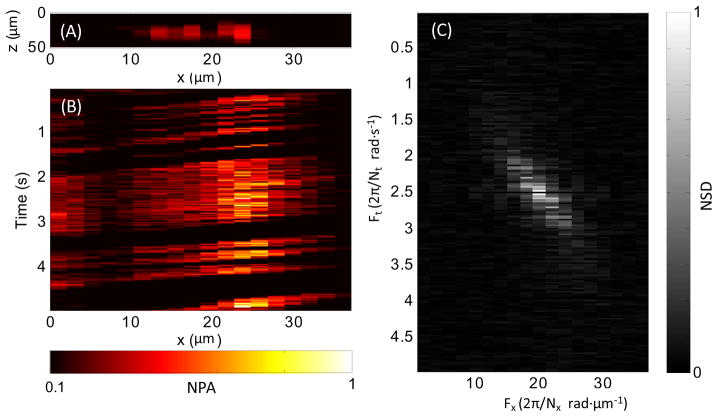
(A) In vivo B-scan of single RBCs flowing in a mouse ear capillary. (B) MAP along the z-axis of the B-scan image versus time (Media 1). (C) Two-dimensional frequency spectrum of the data in Fig. 5(B). NPA: normalized photoacoustic amplitude; NSD: normalized spectrum density.
References
-
- Wang X, Pang Y, Ku G, Xie X, Stoica G, Wang LV. Noninvasive laser-induced photoacoustic tomography for structural and functional in vivo imaging of the brain. Nature Biotechnol. 2003;21:803–806. - PubMed
-
- Copland JA, Eghtedari M, Popov VL, Kotov N, Mamedova N, Motamedi M, Oraevsky AA. Bioconjugated gold nanoparticles as a molecular based contrast agent: Implications for imaging of deep tumors using optoacoustic tomography. Mol Imaging Biol. 2004;6:341–349. - PubMed
-
- Siphanto RI, Thumma KK, Kolkman RGM, van Leeuwen TG, de Mul FFM, van Neck JW, van Adrichem LNA, Steenbergen W. Serial noninvasive photoacoustic imaging of neovascularization in tumor angiogenesis. Opt Express. 2005;13:89–95. - PubMed
-
- Zhang HF, Maslov K, Stoica G, Wang LV. Functional photoacoustic microscopy for high-resolution and noninvasive in vivo imaging. Nature Biotechnology. 2006;24:848–851. - PubMed
-
- Maslov K, Zhang HF, Hu S, Wang LV. Optical-resolution photoacoustic microscopy for in vivo imaging of single capillaries. Optics Letters. 2008;33(9):929–931. - PubMed
Publication types
MeSH terms
Grants and funding
LinkOut - more resources
Full Text Sources
Other Literature Sources
