. 2011 Jan 17;19(2):1016-26.
doi: 10.1364/OE.19.001016.

Spatial light interference microscopy (SLIM)

Affiliations

Spatial light interference microscopy (SLIM)

Zhuo Wang et al. Opt Express. .

Abstract

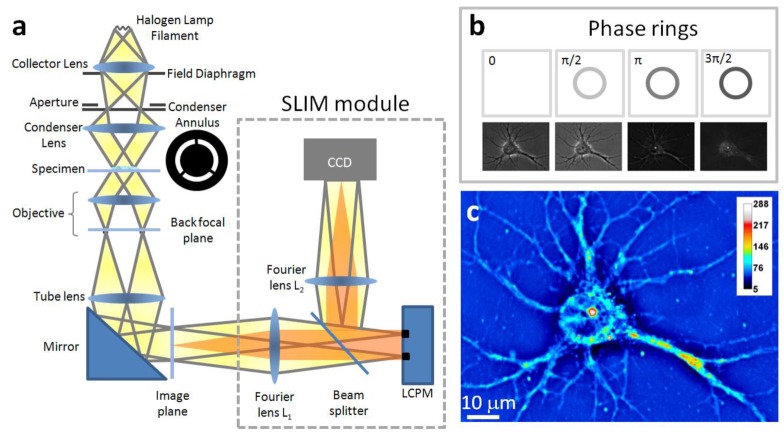
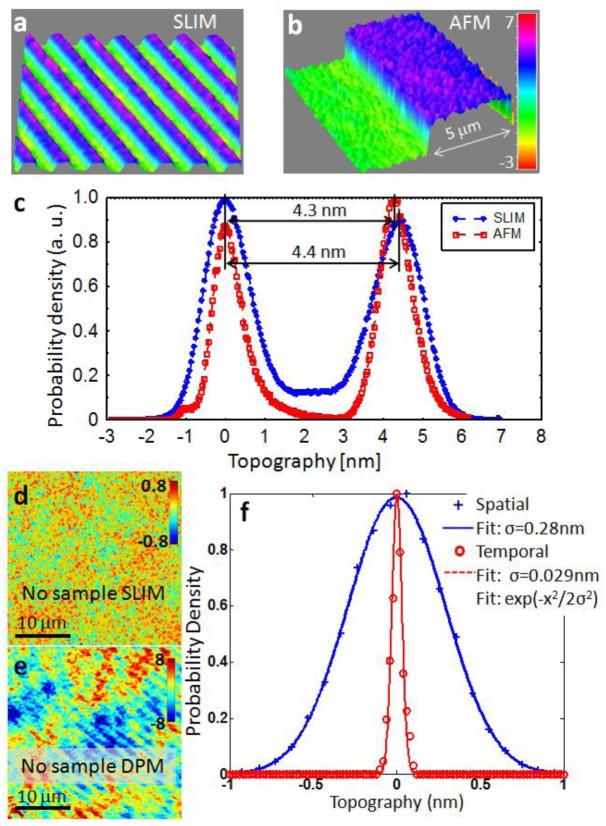
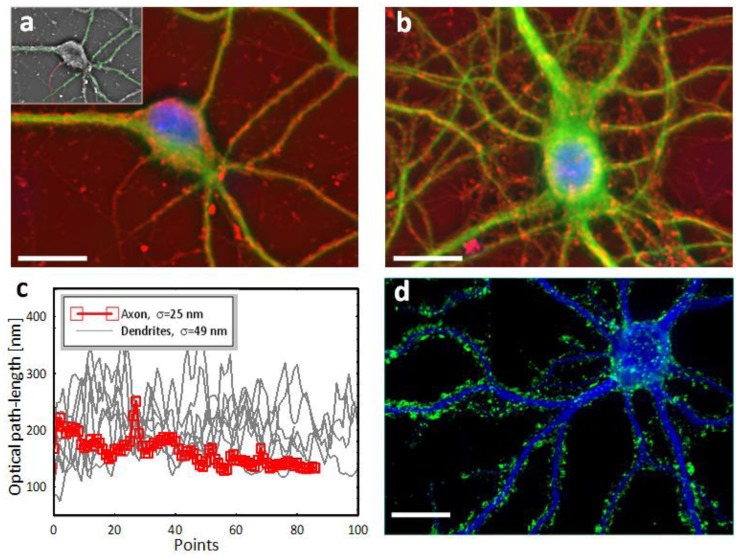
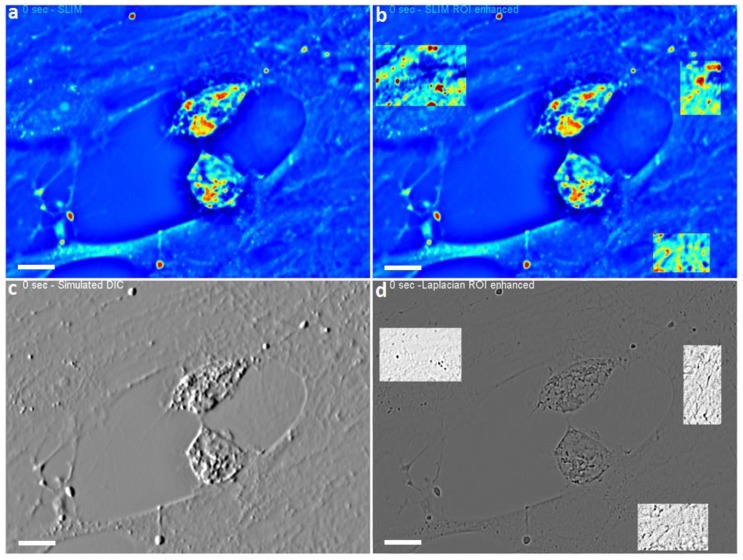
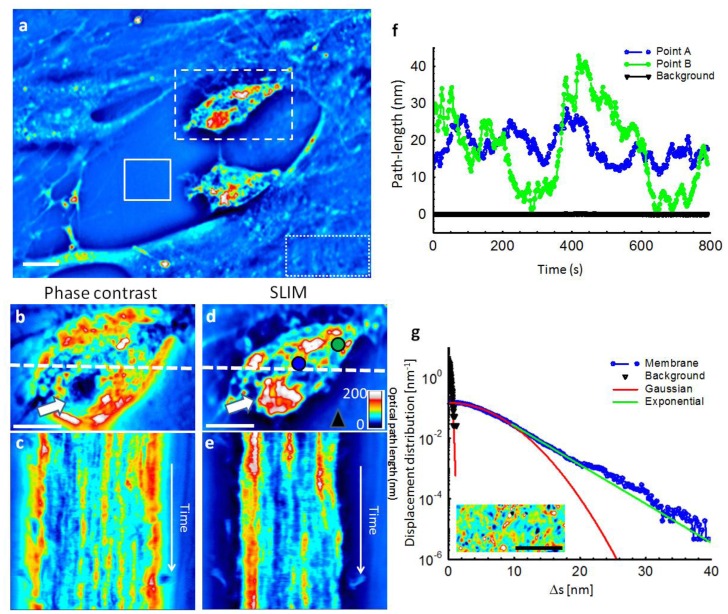
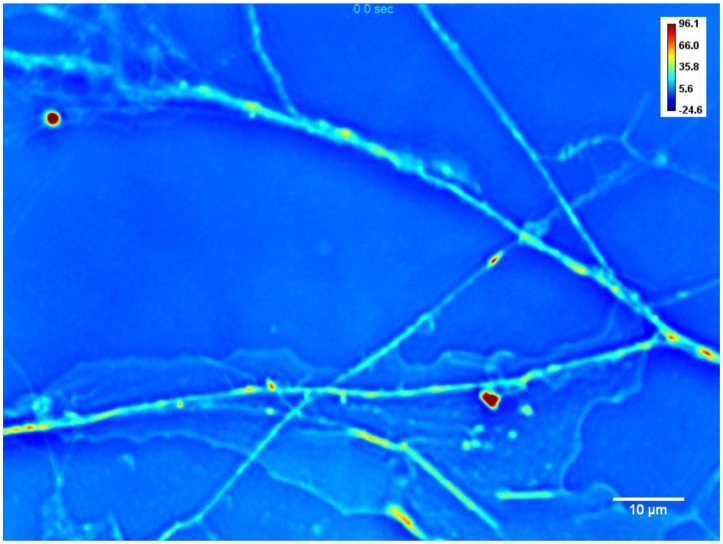
We present spatial light interference microscopy (SLIM) as a new optical microscopy technique, capable of measuring nanoscale structures and dynamics in live cells via interferometry. SLIM combines two classic ideas in light imaging: Zernike's phase contrast microscopy, which renders high contrast intensity images of transparent specimens, and Gabor's holography, where the phase information from the object is recorded. Thus, SLIM reveals the intrinsic contrast of cell structures and, in addition, renders quantitative optical path-length maps across the sample. The resulting topographic accuracy is comparable to that of atomic force microscopy, while the acquisition speed is 1,000 times higher. We illustrate the novel insight into cell dynamics via SLIM by experiments on primary cell cultures from the rat brain. SLIM is implemented as an add-on module to an existing phase contrast microscope, which may prove instrumental in impacting the light microscopy field at a large scale.


Figures

Fig. 1
Fig. 1
SLIM principle. (a) Schematic setup for SLIM. The SLIM module is attached to a commercial phase contrast microscope (Axio Observer Z1, Zeiss, in this case). The lamp filament is projected onto the condenser annulus. The annulus is located at the focal plane of the condenser, which collimates the light towards the sample. For conventional phase contrast microscopy, the phase objective contains a phase ring, which delays the unscattered light by a quarter wavelength and also attenuates it by a factor of 5. The image is delivered via the tube lens to the image plane, where the SLIM module processes it further. The Fourier lens L1 relays the back focal plane of the objective onto the surface of the liquid crystal phase modulator (LCPM, Boulder Nonlinear). By displaying different masks on the LCPM, the phase delay between the scattered and unscattered components is modulated accurately. Fourier lens L2 reconstructs the final image at the CCD plane, which is conjugated with the image plane. (b) The phase rings and their corresponding images recorded by the CCD. (c) SLIM quantitative phase image of a hippocampal neuron.
Fig. 2
Fig. 2
(a) Spectrum of the white light emitted by the halogen lamp. The center wavelength is 552.3 nm. (b) The autocorrelation function (blue solid line) and its envelope (red dotted line). The 4 circles indicate the phase shifts produced by LCPM. The refractive index of the medium is 1.33. (c). Intensity modulation obtained by displaying different grayscale values on the LCPM. (d) Phase vs. gray scale calibration curve obtained by Hilbert transform of the signal in (c).
Fig. 3
Fig. 3
Comparison between SLIM and AFM. (a) SLIM image of an amorphous carbon film. (b) AFM image of the same sample. with the colorbar indicating thickness in nm. (c) Topographical histogram for AFM and SLIM, as indicated. (d) Topography noise in SLIM; color bar in nanometers. (e) Topography noise associated with diffraction phase microscopy, a laser-based technique; color bar in nanometers. (f) Optical path-length noise level measured spatially and temporally, as explained in text. The solid lines indicate Gaussian fits, with the standard deviations as indicated.
Fig. 4
Fig. 4
SLIM-fluorescence multimodal imaging. (a)-(b) Combined multimodal images of cultured neurons (19 DIV) acquired through SLIM (red) and fluorescence microscopy of anti-MAP2 stained soma and dendrites (green) and DAPI-stained nuclei (blue). (c) Optical path-length fluctuations along the dendrites (green) and axon (red) retrieved from the inset of (a). (d) Synaptic boutons of a mature hippocampal neuron (33 DIV) immunochemically labeled for synapsin (green) and MAP2 (blue). Scale bars: 20 μm.
Fig. 5
Fig. 5
( Media 1) SLIM simulated DIC and Laplacian. Since the quantitative phase information is obtained, all other microscopy such as DIC, phase contrast and dark field can be numerically simulated through SLIM imaging. Objective: Zeiss EC Plan-Neofluar 40 × /0.75. (a) SLIM imaging of glial-microglia cell culture. (b) SLIM imaging with ROI (region of interest) enhancement. (c) Simulated DIC-based on the phase measurement of SLIM. (d) Laplacian of SLIM image with ROI enhancement. Scale bars: 10 μm.
Fig. 6
Fig. 6
( Media 2) SLIM dynamic imaging of mixed glial-microglial cell culture. Two reactive microglia probe neighboring cellular environments with highly dynamic lamellipodia and begin engulfing matter through long, thin projections in serum-starved primary mixed glial cultures. Actin polymerization and depolymerization are evident in the membrane area. SLIM reveals changes in optical path length of these dynamic cellular behaviors. Objective: Zeiss EC Plan-Neofluar 40 × /0.75. (a) Phase map of two microglia cells active in a primary glial cell culture. Solid line box indicates the background used in (g), dashed line box delineates a reactive microglial cell used in (b)-(e) and dotted line box indicates the glial cell membrane used in (g). (b) Phase contrast image of the cell shown in (a). psuedocoloration is for light intensity signal and has no quantitative meaning for phase contrast. (c) Registered time-lapse projection of the corresponding cross-section through the cell as indicated by the dash line in (b). (d) SLIM image of the cell in (b); the fields of view are the same. The arrows in (b) and (d) point to the nucleus which is incorrectly displayed by phase contrast as a region of low signal. (e) Registered time-lapse projection of the corresponding cross-section through the cell, as indicated by the dash line in (d). (f) Path-length fluctuations of the points on the cell (indicated in d) showing intracellular motions (blue- and green-filled circles). Background fluctuations (black) are negligible compared to the active signals of the microglia. (g) Semi-logarithmic plot of the optical path-length displacement distribution associated with the glial cell membrane indicated by the dotted box in (a). The solid lines show fits with a Gaussian and exponential decay, as indicated in the legend. The distribution crosses over from a Gaussian to an exponential behavior at approximately 10 nm. The background path-length distribution, measured from the solid line box, has a negligible effect on the signals from cells and is fitted very well by a Gaussian function. The inset shows an instantaneous path-length displacement map associated with the membrane. Scale bars, 10 μm (a), (b), (d) and (g).
Fig. 7
Fig. 7
( Media 3) SLIM imaging of live hippocampal neuron. in primary cell culture. Through SLIM bidirectional microtubule-mediated transport is prominently evident in neurites, individually or in neurite bundles. Slower dynamic leading edges of advancing glial membranes expand short distances across the coverslip. Actin polymerization and depolymerization are evident in the membrane area. SLIM reveals changes in optical path length of these dynamic cellular behaviors. Colorbar indicates path-length in nm. Objective: Zeiss Plan-Apochromat 63 × /1.4 Oil.

Similar articles

Cited by

References

    1. Zernike F., “How I discovered phase contrast,” Science 121(3141), 345–349 (1955).10.1126/science.121.3141.345 - DOI - PubMed
    1. G. Popescu, “Quantitative phase imaging of nanoscale cell structure and dynamics,” in Methods in Cell Biology, P. J. Bhanu, ed. (Elsevier, 2008), p. 87. - PubMed
    1. Paganin D., Nugent K. A., “Noninterferometric phase imaging with partially coherent light,” Phys. Rev. Lett. 80(12), 2586–2589 (1998).10.1103/PhysRevLett.80.2586 - DOI
    1. Zicha D., Dunn G. A., “An Image-Processing System For Cell Behavior Studies In Subconfluent Cultures,” J. Microsc. 179, 11–21 (1995).10.1111/j.1365-2818.1995.tb03609.x - DOI
    1. Yang C. H., Wax A., Dasari R. R., Feld M. S., “Phase-dispersion optical tomography,” Opt. Lett. 26(10), 686–688 (2001).10.1364/OL.26.000686 - DOI - PubMed

Publication types