. 2011 Jan 17;6(1):e14498.
doi: 10.1371/journal.pone.0014498.

Dynamics of macrophage trogocytosis of rituximab-coated B cells

Affiliations

Dynamics of macrophage trogocytosis of rituximab-coated B cells

Theodore Pham et al. PLoS One. .

Abstract

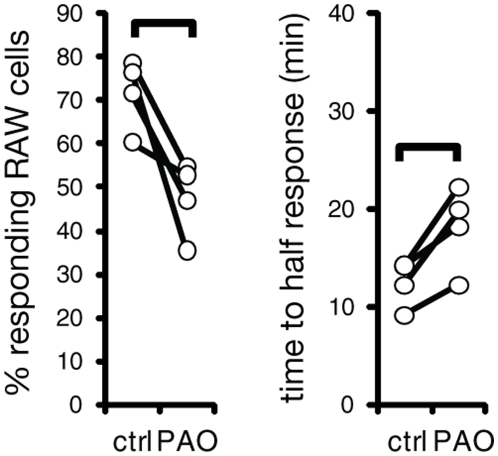
Macrophages can remove antigen from the surface of antibody-coated cells by a process termed trogocytosis. Using live cell microscopy and flow cytometry, we investigated the dynamics of trogocytosis by RAW264.7 macrophages of Ramos B cells opsonized with the anti-CD20 monoclonal antibody rituximab. Spontaneous and reversible formation of uropods was observed on Ramos cells, and these showed a strong enrichment in rituximab binding. RAW-Ramos conjugate interfaces were highly enriched in rituximab, and transfer of rituximab to the RAW cells in submicron-sized puncta occurred shortly after cell contact. Membrane from the target cells was concomitantly transferred along with rituximab to a variable extent. We established a flow cytometry-based approach to follow the kinetics of transfer and internalization of rituximab. Disruption of actin polymerization nearly eliminated transfer, while blocking phosphatidylinositol 3-kinase activity only resulted in a delay in its acquisition. Inhibition of Src family kinase activity both slowed acquisition and reduced the extent of trogocytosis. The effects of inhibiting these kinases are likely due to their role in efficient formation of cell-cell conjugates. Selective pre-treatment of Ramos cells with phenylarsine oxide blocked uropod formation, reduced enrichment of rituximab at cell-cell interfaces, and reduced the efficiency of trogocytic transfer of rituximab. Our findings highlight that dynamic changes in target cell shape and surface distribution of antigen may significantly influence the progression and extent of trogocytosis. Understanding the mechanistic determinants of macrophage trogocytosis will be important for optimal design of antibody therapies.


Conflict of interest statement

Competing Interests: The authors have declared that no competing interests exist.

Figures

Figure 1
Figure 1. Dynamic morphology of Ramos B cells.
Selected frames from live microscopic imaging of RTX-Al488 coated Ramos cells (Videos S1). Ramos cells were able to adhere to the substratum by the formation of a uropod as seen at the first time of observation (0 min), and at 10 and 15 minutes afterwards. RTX-Al488 (green) was enriched at uropods, while being depleted from the opposite, mobile end. Scale bar 10 µm.
Figure 2
Figure 2. Concentration of RTX at RAW-Ramos interfaces.
(A) Volumetric reconstruction from confocal slices of a Ramos-RAW cell interface. RTX-Al488-coated (green), PKH26-labelled Ramos cells (red) were incubated with RAW cells for 45 minutes at 37°C. RAW cells were labelled with anti-CD11b-APC (cyan). The RAW cell has extensively trogocytosed both RTX and PKH26. Inset shows the dotted area above it without the PKH26 channel overlaid, revealing the concentration of RTX-Al488 at the cell-cell interface, otherwise depleted from the rest of the Ramos cell. Trogocytosis reaction was halted by fixation 45 min after co-incubation. Ramos cells are approximately 12 µm in diameter. (B) Deconvolved epifluorescence images from live experiment of PKH26-labelled, RTX-Al488 coated Ramos after coincubation with RAW cells for 1 hour. Extended focus and volumetric representations of the imaged slices show accumulation of RTX-Al488 at the interface. Scale bar 5 µm. Unit size for volume 3.3 µm. (C) Frames from live microscopic imaging following a RTX-Al488 coated Ramos cell settling onto a RAW macrophage. Extensive RAW membrane ruffling occurs to capture the uropod (black arrow, 9 minutes), and RTX is internalized shortly after (white arrow, 13.5 minutes). See Videos S3. Scale bar 10 µm.
Figure 3
Figure 3. Effect of treatment of Ramos cells with PAO on cell polarization and RTX accumulation at cell-cell interfaces.
Opsonized Ramos cells were treated with 30 µM PAO or DMSO vehicle for 10 min then washed. (A) Cell morphology and RTX distribution on live Ramos cells. (B) Quantitation of effect of PAO on Ramos cell polarization. Images of live cells were acquired after treatment with PAO or DMSO, and the fraction of total cells showing a polarized morphology at the moment of image acquisition was scored. Error bars show standard deviation (n = 4 experiments, with >300 cells scored per condition in each experiment (p<0.05)). (C) Comparison of RTX accumulation at the interfaces between RAW and Ramos cells with or without pretreatment of Ramos cells with PAO. Deconvolved volumes and extended focus representations of target-trogocyte interfaces are presented. Interfaces were imaged after 15 minutes of allowing cells to interact. Arrows indicate zones of contact between RAW and Ramos (*) cells. Similar results were seen in 3 independent experiments. Scale bars 10 µm.
Figure 4
Figure 4. Distribution of trogocytosed RTX within RAW cells.
Acquired RTX-Al488 becomes widely distributed in RAW cells (*). Image taken 70 minutes after the addition of RTX-Al488 coated Ramos. Scale bar 10 µm. See Video S6.
Figure 5
Figure 5. Cotransfer of PKH26 and RTX.
(A) Simultaneous acquisition of PKH26 and RTX-Al488 by RAW cells from Ramos cells was analyzed by flow cytometry. (B) Lack of acquisition of PKH26 and RTX-Al488 by RAW cells after 45 minutes when opsonization of Ramos cells was omitted (no RTX), or when RAW cells were provided with culture supernatants of RTX/PKH labelled Ramos cells incubated for the same amount of time (passive transfer). (C) RAW cells that have internalized mainly RTX (green), or both RTX and PKH26 (yellow). Ramos cells indicated by asterisks. Scale bar 10 µm.
Figure 6
Figure 6. Kinetic analysis of acquisition and internalization of RTX by flow cytometry.
Internalization of acquired RTX was assessed by its inaccessibility to labelling with anti-human antibody. (A) RTX-Al488 coated Ramos cells were coincubated with RAW cells at 37°C for the times indicated. After staining with anti-human antibody, RAW cells were detached and identified by gating on CD11b+ events. Bottom right plot shows a schematic of the progression of RAW cells in the kinetic analysis of trogocytosis. Indicated numbers are percentage of events in each quadrant out of the DN, DP, and SP populations. (B) The proportion of RAW cells in the DN population was fitted to a model as described in Methods. (C) Confocal slices of cells representative of trogocytic stages. Scale bar 10 µm.
Figure 7
Figure 7. Kinetic analysis of chemical inhibition of trogocytosis.
(A) Analysis of RTX transfer and internalization as in Figure 5 after 45 min of trogocytosis in the presence of indicated inhibitors. cD, cytochalasin D. (B) Example kinetics of control versus PP1-inhibited trogocytosis. (C) Comparison of percent responding RAW cells under different conditions. Linked pairs indicate individual experiments. Braces indicate significance (p<0.05), n = 3 for each control-inhibitor pair. For cytochalasin D experiments, percent responding RAW cells (control and cytochalasin D-treated) are indicated by the percent responding at 90 minutes rather than the modelled asymptote. (D) Comparison of time to half-response under different conditions. (E) Effect of inhibitors on acquisition of PKH26 at 90 minutes relative to media-treated RAW cells. Error bars indicate standard deviation, n = 3 for each treatment. (F) Effect of inhibitors on Ramos cell polarization (black bars) and concentration of RTX at uropods (white bars). Error bars indicate standard deviation. Only cytochalasin D causes significant inhibition (p<0.05, n = 4).
Figure 8
Figure 8. Effect of pre-treatment of Ramos cells with PAO on trogocytosis.
Ramos cells were pretreated with 30 µM PAO for 10 min and washed before addition to RAW cells. Trogocytosis of RTX was analyzed by flow cytometry for percent responding RAW cells and time to half-response. Linked pairs indicate individual experiments. Braces indicate significant difference (p<0.05, n = 4).
Figure 9
Figure 9. Trogocytosis may involve components of both the phagocytosis and endocytosis machinery.

References

    1. Greenberg S, Grinstein S. Phagocytosis and innate immunity. Curr Opin Immunol. 2002;14:136–145. 10.1016/S0952-7915(01)00309-0. - PubMed
    1. Booth JW, Kim MK, Jankowski A, Schreiber AD, Grinstein S. Contrasting requirements for ubiquitylation during Fc receptor-mediated endocytosis and phagocytosis. EMBO J. 2002;21:251–258. 10.1093/emboj/21.3.251. - PMC - PubMed
    1. Mero P, Zhang CY, Huang ZY, Kim MK, Schreiber AD, et al. Phosphorylation-independent Ubiquitylation and Endocytosis of Fc{gamma}RIIA. J Biol Chem. 2006;281:33242–33249. 10.1074/jbc.M605372200. - PubMed
    1. Tse SM, Furuya W, Gold E, Schreiber AD, Sandvig K, et al. Differential role of actin, clathrin, and dynamin in Fc gamma receptor-mediated endocytosis and phagocytosis. J Biol Chem. 2003;278:3331–3338. 10.1074/jbc.M207966200. - PubMed
    1. Joly E, Hudrisier D. What is trogocytosis and what is its purpose? Nat Immunol. 2003;4:815. 10.1038/ni0903-815. - PubMed

Publication types