. 2011 Jan 12;6(1):e16032.
doi: 10.1371/journal.pone.0016032.

Identification and validation of novel cerebrospinal fluid biomarkers for staging early Alzheimer's disease

Affiliations

Identification and validation of novel cerebrospinal fluid biomarkers for staging early Alzheimer's disease

Richard J Perrin et al. PLoS One. .

Abstract

Background: Ideally, disease modifying therapies for Alzheimer disease (AD) will be applied during the 'preclinical' stage (pathology present with cognition intact) before severe neuronal damage occurs, or upon recognizing very mild cognitive impairment. Developing and judiciously administering such therapies will require biomarker panels to identify early AD pathology, classify disease stage, monitor pathological progression, and predict cognitive decline. To discover such biomarkers, we measured AD-associated changes in the cerebrospinal fluid (CSF) proteome.

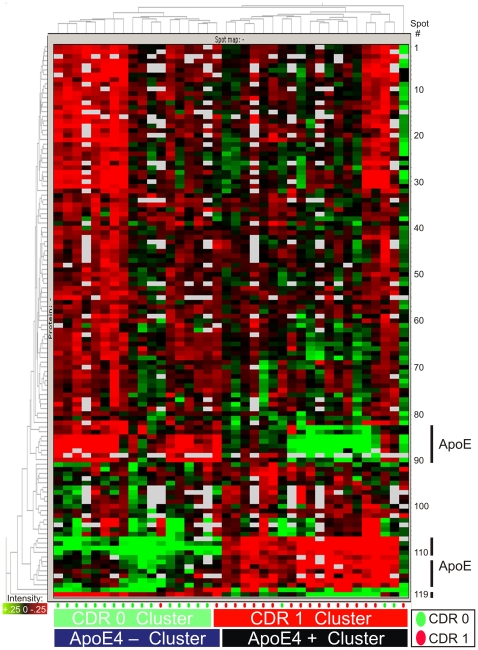
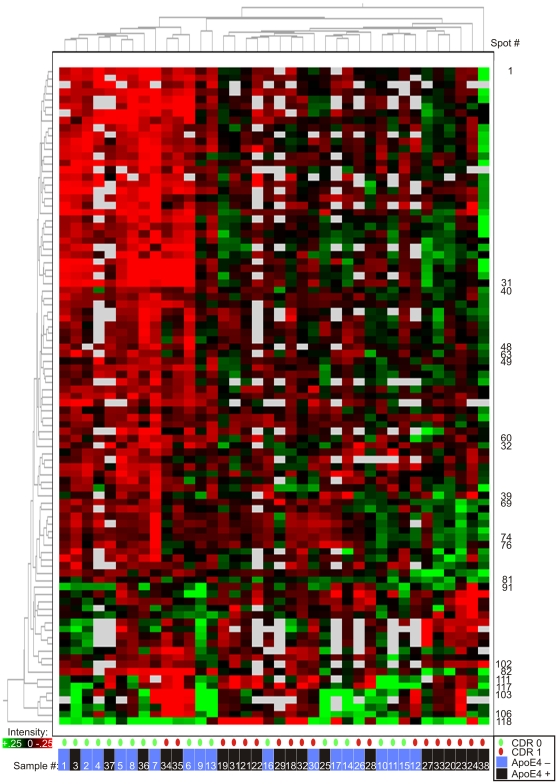
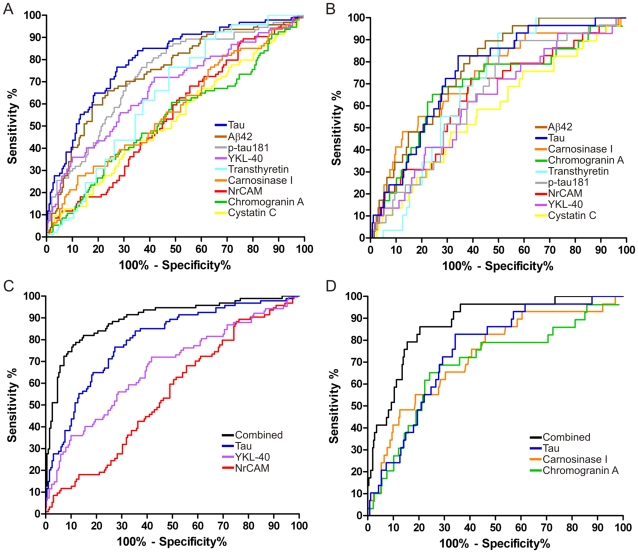
Methods and findings: CSF samples from individuals with mild AD (Clinical Dementia Rating [CDR] 1) (n = 24) and cognitively normal controls (CDR 0) (n = 24) were subjected to two-dimensional difference-in-gel electrophoresis. Within 119 differentially-abundant gel features, mass spectrometry (LC-MS/MS) identified 47 proteins. For validation, eleven proteins were re-evaluated by enzyme-linked immunosorbent assays (ELISA). Six of these assays (NrCAM, YKL-40, chromogranin A, carnosinase I, transthyretin, cystatin C) distinguished CDR 1 and CDR 0 groups and were subsequently applied (with tau, p-tau181 and Aβ42 ELISAs) to a larger independent cohort (n = 292) that included individuals with very mild dementia (CDR 0.5). Receiver-operating characteristic curve analyses using stepwise logistic regression yielded optimal biomarker combinations to distinguish CDR 0 from CDR>0 (tau, YKL-40, NrCAM) and CDR 1 from CDR<1 (tau, chromogranin A, carnosinase I) with areas under the curve of 0.90 (0.85-0.94 95% confidence interval [CI]) and 0.88 (0.81-0.94 CI), respectively.

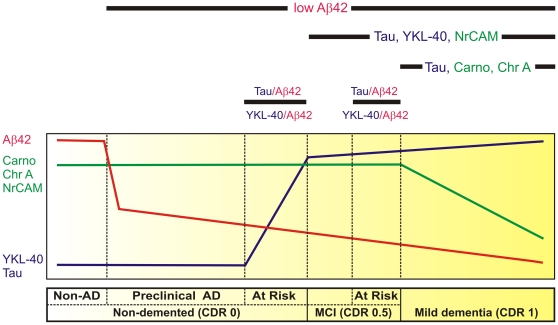
Conclusions: Four novel CSF biomarkers for AD (NrCAM, YKL-40, chromogranin A, carnosinase I) can improve the diagnostic accuracy of Aβ42 and tau. Together, these six markers describe six clinicopathological stages from cognitive normalcy to mild dementia, including stages defined by increased risk of cognitive decline. Such a panel might improve clinical trial efficiency by guiding subject enrollment and monitoring disease progression. Further studies will be required to validate this panel and evaluate its potential for distinguishing AD from other dementing conditions.


Conflict of interest statement

Competing Interests: D.M.H. co-founded C2N Diagnostics, is on the scientific advisory board of C2N Diagnostics, En Vivo, and Satori, consulted for Pfizer, and receives grants that did not support this work from Eli Lilly, Pfizer, and Astra-Zeneca. J.C.M. has consulted for Astra Zeneca, Genentech, and Merck, has received honoraria from ANA Soriano lecture, payment from Journal Watch for preparation of other manuscripts, royalties from Blackwell Publishers and Taylor and Francis, and travel funding for ANA meeting Baltimore. C.M.C. became emeritus at University of Pennsylvania on January 1, 2010, and now works for Avid Radiopharmaceuticals, which did not provide any funding for this study, and did not have any involvement or influence in data production, data analysis, decision to publish, or manuscript preparation. None of the above stated competing interests alter our adherence to all the PLoS ONE policies on sharing data and materials.

Figures

Figure 1
Figure 1. Two-dimensional difference in gel electrophoresis (2D-DIGE) of cerebrospinal fluid immunodepleted of six high abundance proteins.
Representative 2D-DIGE (grayscale) image with labeled locations of 119 gel features that differed in intensity between CDR 0 and CDR 1 groups. Gel features are numbered 1 through 119, and relevant information about each is listed in Table 2 and in Table S1. Approximate molecular weight (in kilodaltons [kDa]) is indicated along the right border; isoelectric point ranges from 3 (left) to 11(right) and is non-linear (not shown). The large, intense, protein spots commonly attributed to transthyretin are boxed; a subset of the differentially abundant gel features in which transthyretin was identified by mass spectrometry is circled.
Figure 2
Figure 2. Unsupervised clustering of CSF samples by 2D-DIGE data from the 119 statistically significant gel features.
(Student's t-test, α = 0.05, present in >50% of images). Five gels containing hemoglobin (n = 10 samples) were excluded. Columns represent samples; rows, numbered 1 through 119 from top to bottom, represent gel features depicted in Figure 1. Gel feature intensity is encoded colorimetrically from red (low intensity) to green (high intensity); white indicates absent data. CDR status of individuals at time of CSF collection is encoded below by small green (CDR 0) and red (CDR 1) ovals; CDR 0 and CDR 1 clusters are indicated below by green and red bars, respectively. APOE-ε4 allele status of individuals and groups, alike, is indicated by black (possessing ApoE4 protein, or one or two APOE-ε4 alleles) or blue (possessing no ApoE4 protein, or no APOE-ε4 alleles) bars. Rows representing gel features containing ApoE protein are indicated along the lower right border.
Figure 3
Figure 3. Unsupervised clustering of CSF samples by 2D-DIGE data, excluding gel features containing apoE protein.
All other statistically significant gel features (Student's t-test α = 0.05, present in >50% of images) are retained. As in Figure 2, five gels containing hemoglobin (n = 10 samples) were excluded. Columns represent samples, numbered according to their original positions in Figure 2. Rows represent gel features, numbered as in Figure 2; unlabeled rows are in consecutive order from upper number to lower number, with interruptions in sequence indicated by labels. ApoE-containing features are removed. Gel feature intensity is encoded colorimetrically from red (low intensity) to green (high intensity); white indicates absent data. CDR status of participants at time of CSF collection is encoded below, by small green (CDR 0) and red (CDR 1) ovals. APOE-ε4 status (as described for Figure 2) is indicated by blue (ApoE4 negative) or black (ApoE4 positive) bars, below. Clustering pattern of samples (numbered consecutively in order of appearance in Figure 2, from left to right) relative to Figure 2 is indicated by white numerals, below.
Figure 4
Figure 4. Quantitative ELISAs for 11 biomarker candidates applied to ‘discovery’ cohort CSF samples (n = 47).
Each assay performed in triplicate; mean value reported for each sample. The six assays represented in the upper two rows (A. YKL-40, B. Transthyretin, C. NrCAM, D. Chromogranin A, E. Carnosinase I, and F. Cystatin C) measured differences between CDR 0 and CDR 1 groups (unpaired t-test); the five assays represented in the lower two rows (G. ApoE, H. PEDF, I. Clusterin, J. Ceruloplasmin, K. β-2 microglobulin) did not.
Figure 5
Figure 5. Six biomarker candidates and established biomarkers tau, p-tau181 and Aβ42 in ‘validation’ cohort CSF (n = 292).
Each candidate biomarker assay was performed in triplicate, with one mean value reported for each sample; assays for tau, p-tau181 and Aβ42 were performed in duplicate. In addition to A. tau, B. p-tau181 and C. Aβ42 (top row), four assays (D. YKL-40, E. carnosinase I, F. chromogranin A, G. NrCAM) measured statistical differences between clinically defined groups, as indicated; H. transthyretin and I. cystatin C did not reach criterion (α = 0.05) for any comparisons. * p<0.05; * * p<0.01; * * * p< 0.001; * * * * p<0.0001; solid circle p<0.05 by LSD only; double solid circle p<0.05 by unpaired t-test and Mann-Whitney, not by unpaired t-test with Welch's correction.
Figure 6
Figure 6. Receiver Operating Characteristic (ROC) curves of ELISA data from ‘validation’ cohort.
Simple ROC analyses were performed for each biomarker to distinguish A. CDR>0 from CDR 0 (“earlier diagnosis”) and B. CDR 1 from CDR<1 (“early diagnosis”). Stepwise logistic regression models were used to identify combinations of these biomarkers that would distinguish C. CDR>0 from CDR 0 (“earlier diagnosis”), AUC = 0.90 and D. CDR 1 from CDR<1 (“early diagnosis”), AUC = 0.88.
Figure 7
Figure 7. Hypothetical model defines early stages of AD by temporal pattern of CSF protein biomarker levels.
The horizontal bar (below) describes the early clinicopathological progression from cognitive normalcy without AD pathology (‘Non-AD’) to mild dementia in six stages. As depicted by the curves above, Non-AD CSF has high Aβ42 (red line), high chromogranin A (Chr A), carnosinase I (Carno I) and NrCAM (green line), and low YKL-40 and tau (blue line). Reduced CSF Aβ42 correlates with amyloid plaque deposits, the first sign of neuropathologically identifiable AD (‘preclinical AD’) . CSF Aβ42 appears to decrease further as cognition declines from normal (Clinical Dementia Rating [CDR] 0) to very mild cognitive impairment (MCI, CDR 0.5) to mild dementia (CDR 1). When considered as ratios with Aβ42, CSF markers of neuroinflammation (e.g. YKL-40) and neurofibrillary tangle pathology (e.g. tau) appear to increase before and predict the onset of very mild cognitive impairment (MCI, CDR 0.5), defining a CDR 0 group ‘At Risk’ for cognitive decline , , ; YKL-40 and tau also appear to be higher among those who progress rapidly from very mild to mild dementia, defining a CDR 0.5 group ‘At Risk’ for impending cognitive decline , . Reductions in synapse-associated (NrCAM, chromogranin A) and neuronal (carnosinase I) proteins, and increases in YKL-40 and tau mirror the progression and anatomical spread of synaptic and neuronal losses, gliosis and tau pathology associated with cognitive decline, and can be used to define CDR 0.5 and CDR 1.

References

    1. Braak H, Braak E. Frequency of stages of Alzheimer-related lesions in different age categories. Neurobiol Aging. 1997;18:351–357. - PubMed
    1. Morris J, Price J. Pathologic correlates of nondemented aging, mild cognitive impairment, and early stage Alzheimer's disease. J Mol Neurosci. 2001;17:101–118. - PubMed
    1. Price J, Ko A, Wade M, Tsou S, McKeel D, et al. Neuron number in the entorhinal cortex and CA1 in preclinical Alzheimer's disease. Arch Neurol. 2001;58:1395–1402. - PubMed
    1. Barnes LL, Schneider JA, Boyle PA, Bienias JL, Bennett DA. Memory complaints are related to Alzheimer disease pathology in older persons. Neurology. 2006;67:1581–1585. - PMC - PubMed
    1. Markesbery W, Schmitt F, Kryscio R, Davis D, Smith C, et al. Neuropathologic substrate of Mild Cognitive Impairment. Arch Neurol. 2006;63:38–46. - PubMed

Publication types