. 2011 Mar;11(1):52-67.
doi: 10.3758/s13415-010-0011-0.

Cognitive and metacognitive activity in mathematical problem solving: prefrontal and parietal patterns

Affiliations

Cognitive and metacognitive activity in mathematical problem solving: prefrontal and parietal patterns

John R Anderson et al. Cogn Affect Behav Neurosci. 2011 Mar.

Abstract

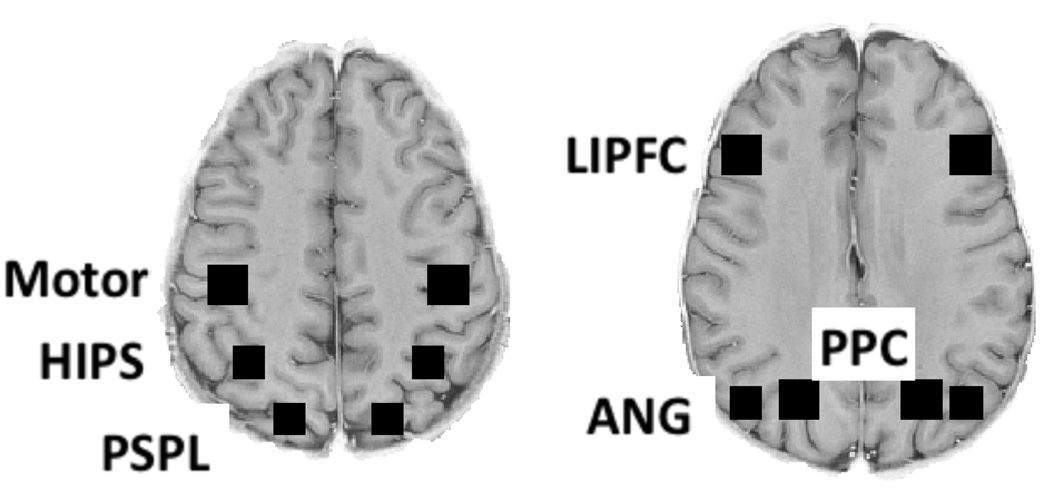
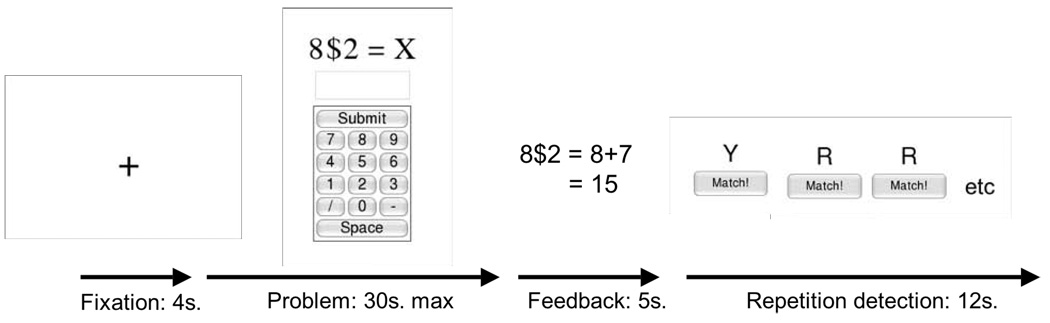
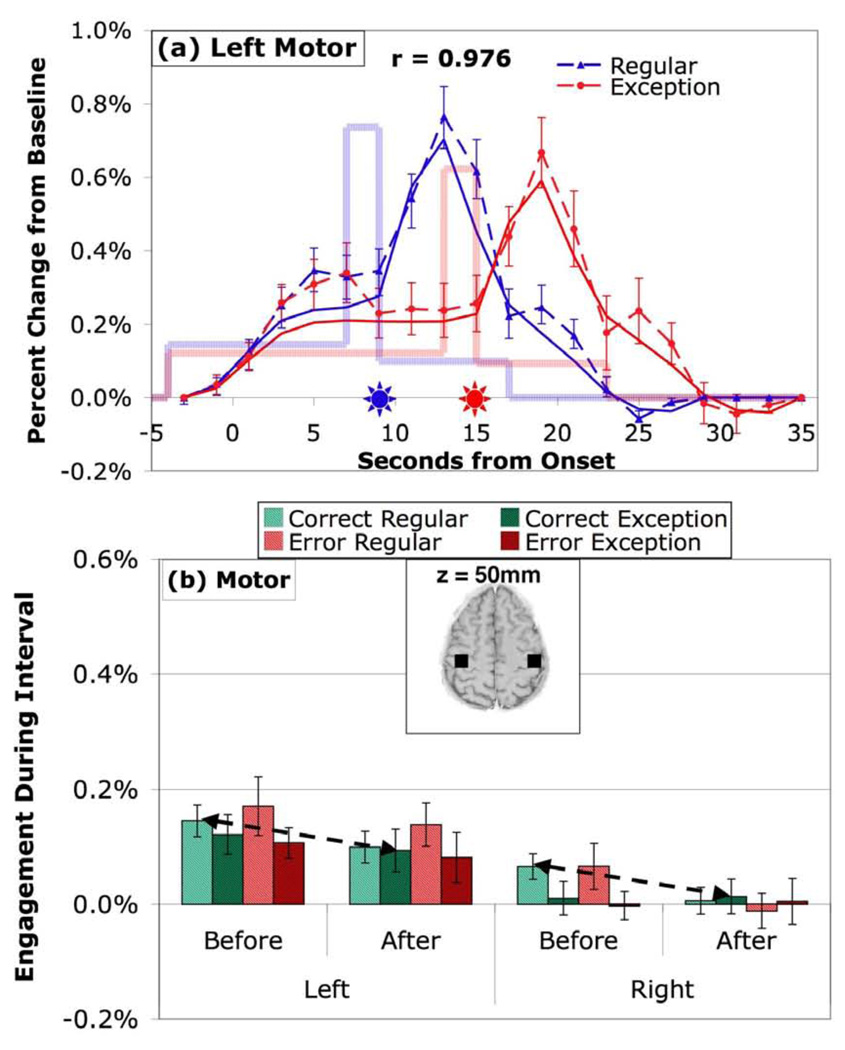
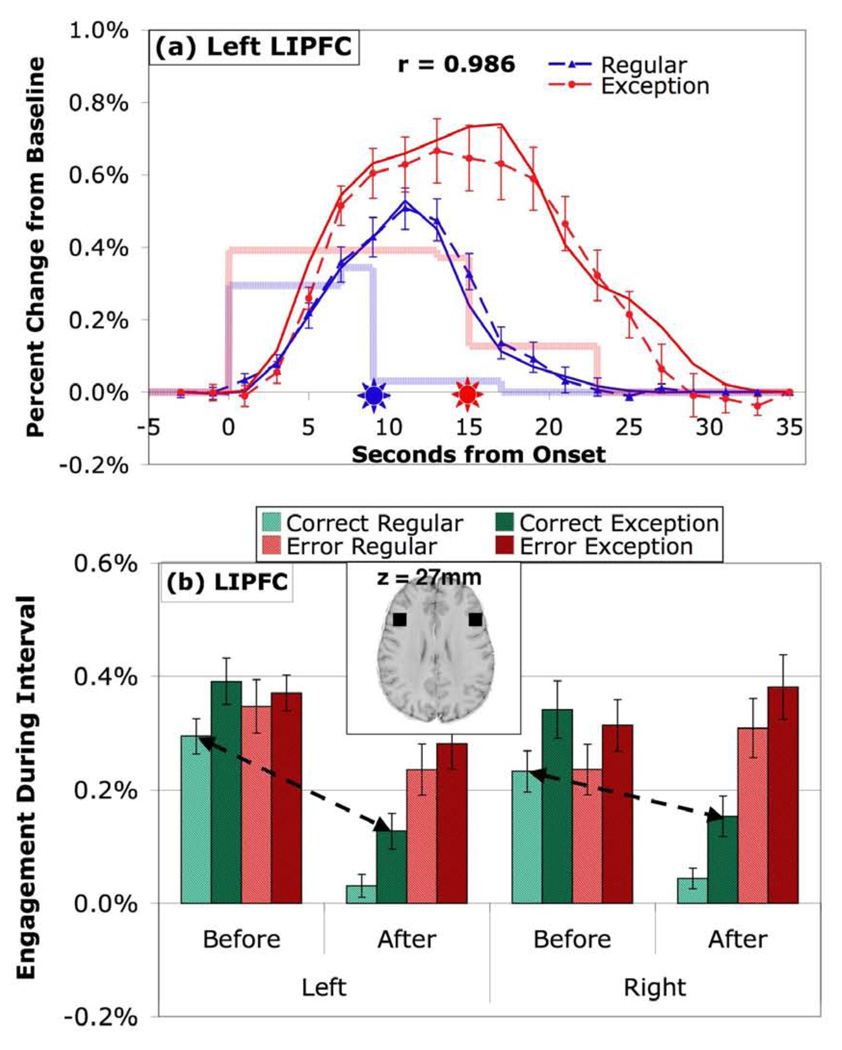
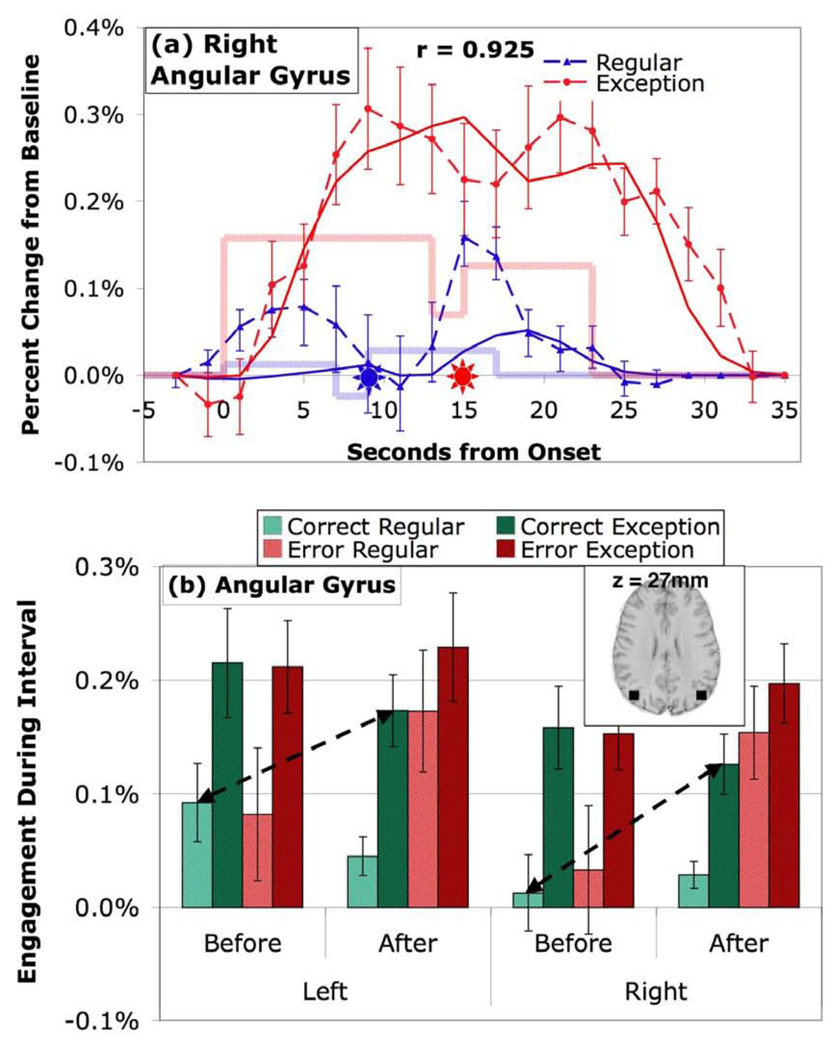
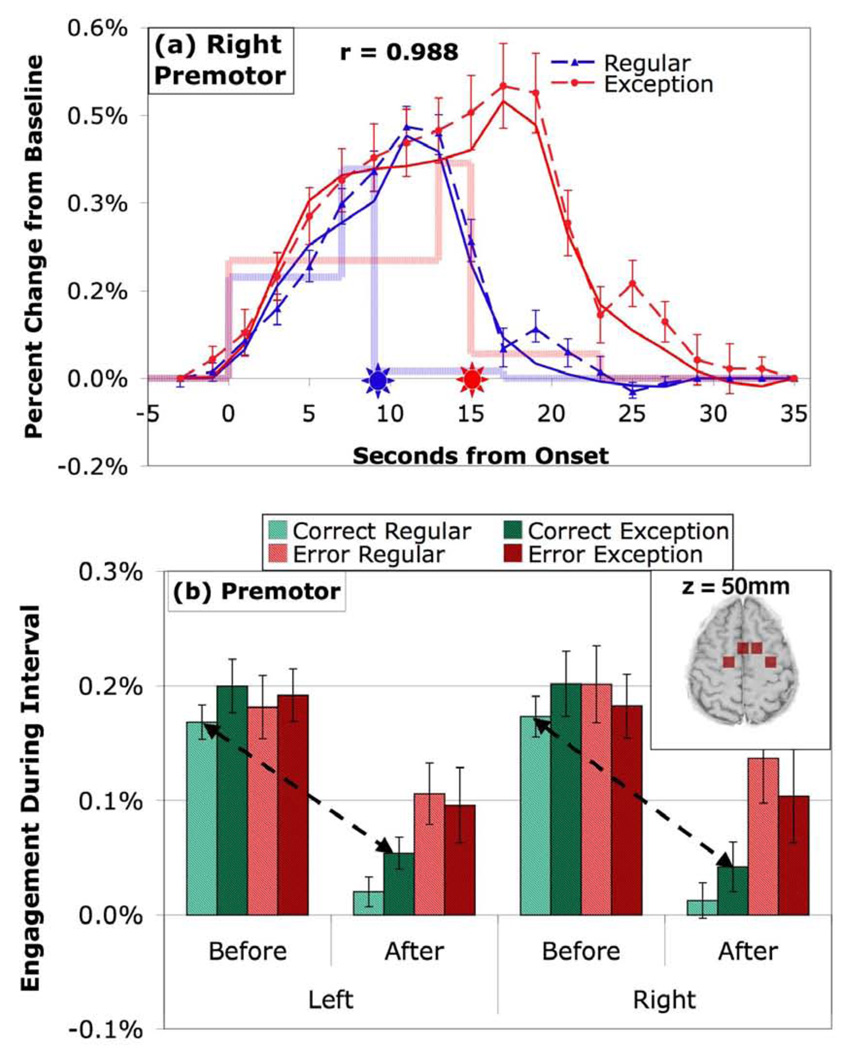
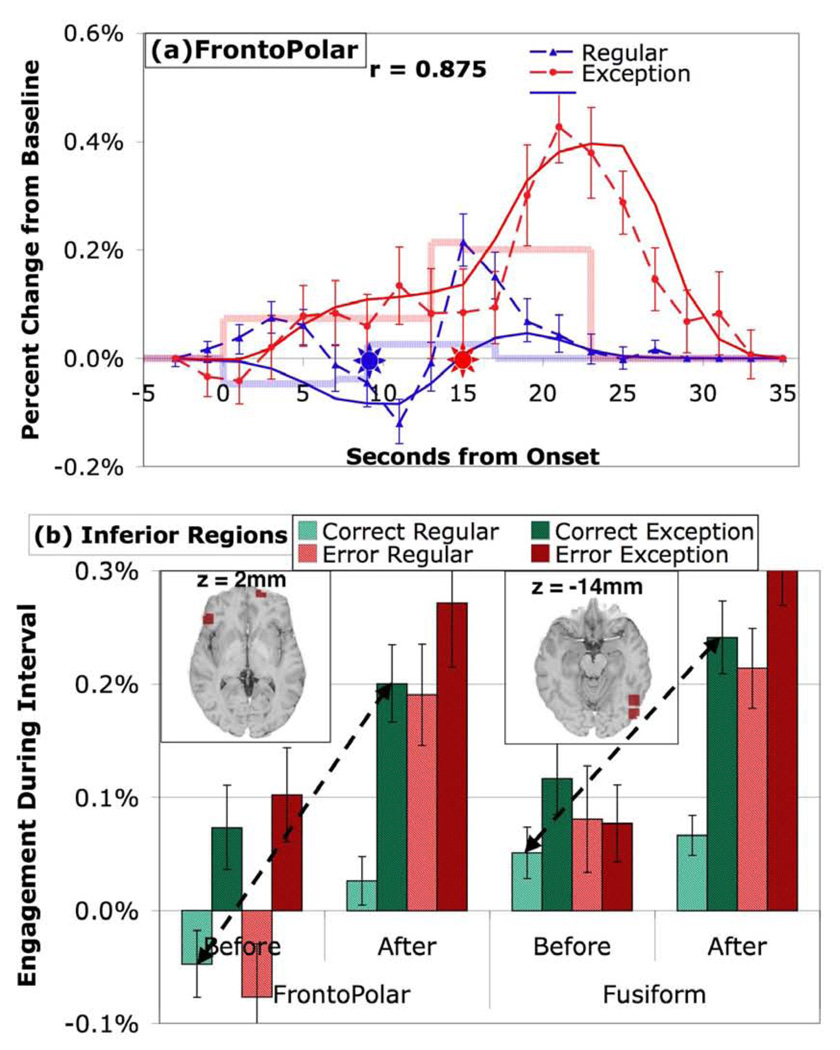
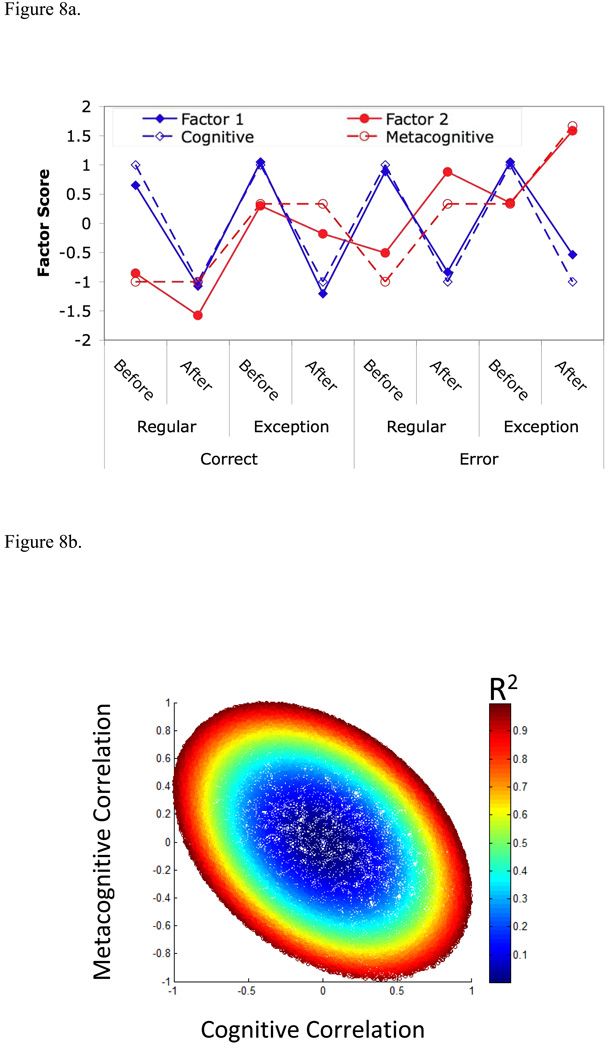
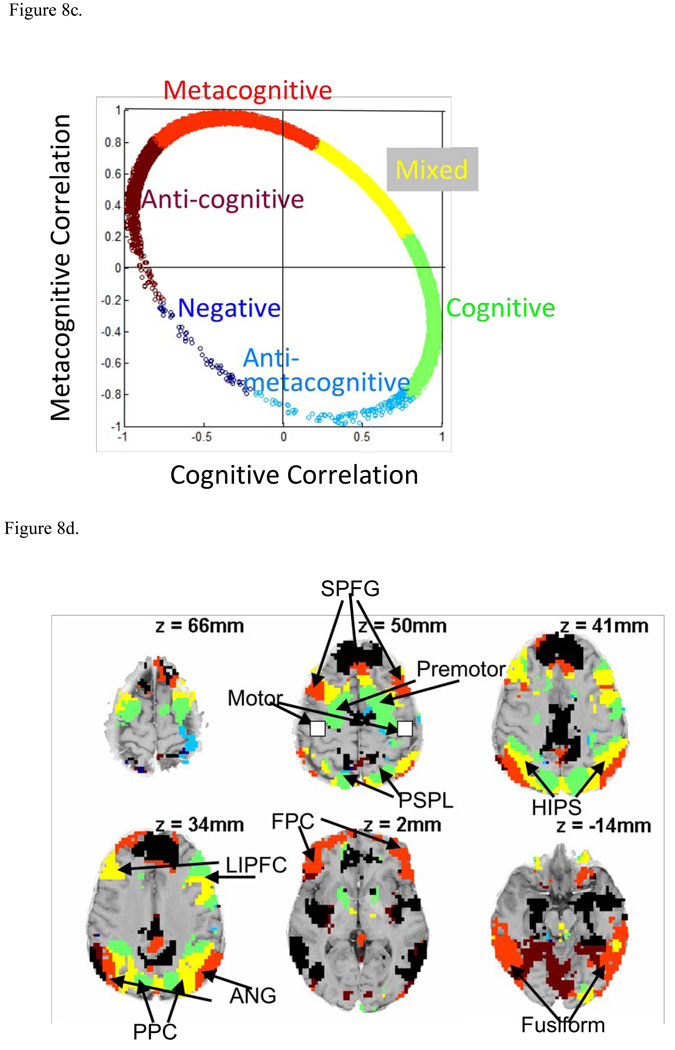
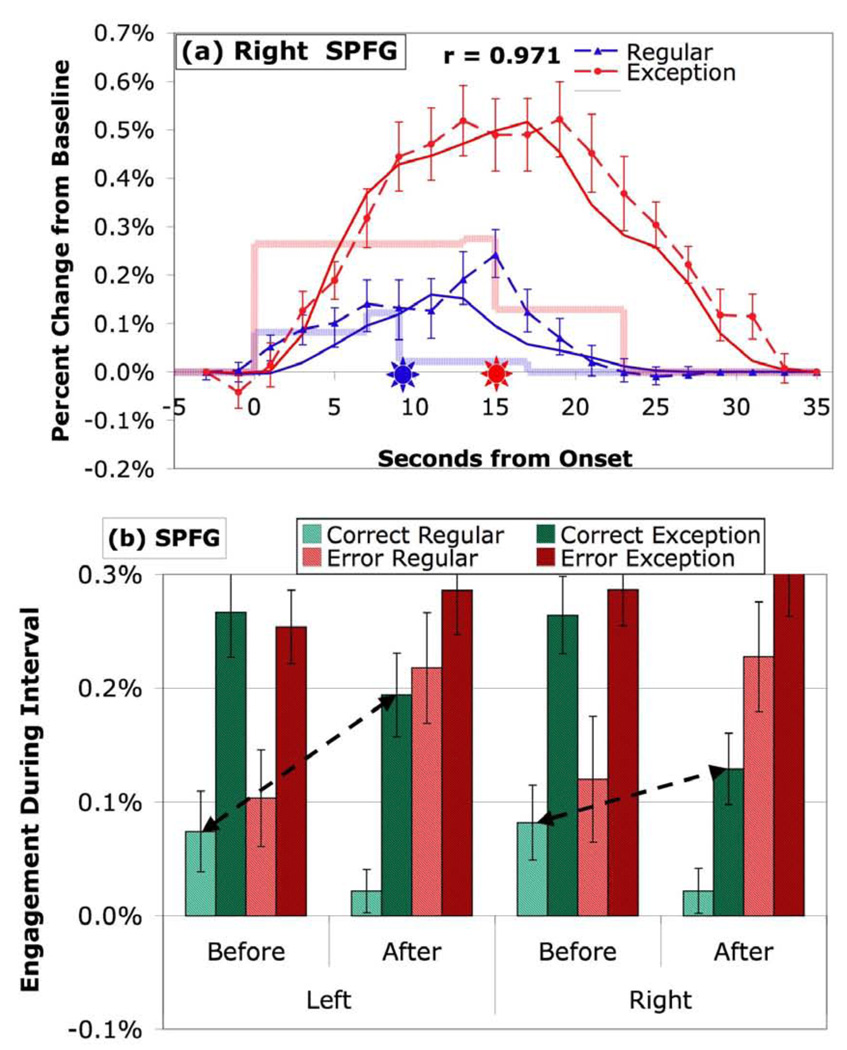
Students were taught an algorithm for solving a new class of mathematical problems. Occasionally in the sequence of problems, they encountered exception problems that required that they extend the algorithm. Regular and exception problems were associated with different patterns of brain activation. Some regions showed a Cognitive pattern of being active only until the problem was solved and no difference between regular or exception problems. Other regions showed a Metacognitive pattern of greater activity for exception problems and activity that extended into the post-solution period, particularly when an error was made. The Cognitive regions included some of parietal and prefrontal regions associated with the triple-code theory of (Dehaene, S., Piazza, M., Pinel, P., & Cohen, L. (2003). Three parietal circuits for number processing. Cognitive Neuropsychology, 20, 487-506) and associated with algebra equation solving in the ACT-R theory (Anderson, J. R. (2005). Human symbol manipulation within an 911 integrated cognitive architecture. Cognitive science, 29, 313-342. Metacognitive regions included the superior prefrontal gyrus, the angular gyrus of the triple-code theory, and frontopolar regions.


Figures

Figure 1
Figure 1
The six predefined regions in the experiment. The Motor region is a 12.8 mm. (high) by 15.6 ×15.6 mm2 region centered at Talairach coordinates +/−41,20,50 spanning Brodmann Areas 1,2, and 3. The posterior superior parietal lobule (PSPL) is a 12.8 mm. (high) by 12.5 ×12.5 mm2 region centered at Talairach coordinates +/−19,−68,55 in Brodmann Area 7. The horizontal intraparietal sulcus (HIPS) is a 12.8 mm. (high) by 12.5 ×12.5 mm2 region centered at Talairach coordinates +/−34,−49,45 in Brodmann Area 40‥ The Lateral Inferior Prefrontal Cortex (LIPFC) is a 12.8 mm. (high) by 15.6 ×15.6 mm2 region centered at Talairach coordinates +/−43,23,24 spanning Brodmann Areas 9 and 46. The Posterior Parietal Cortex (PPC) is a 12.8 mm. (high) by 15.6 ×15.6 mm2 region centered at Talairach coordinates +/−23,−63,40 spanning Brodmann Areas 7 and 39. The angular gyrus (ANG) 12.8 mm. (high) by 12.5 ×12.5 mm2 region centered at Talairach coordinates +/−41,−65,37 in Brodmann Area 39.
Figure 2
Figure 2
An illustration of the sequence of events for each problem. The problem began with a 4-second fixation and then was followed by a problem that stayed on the screen until the participant answered or until 30 seconds were up. Participants responded by clicking the answer in the keypad with a mouse. This was followed by feedback on the correct answer and its derivation. After seeing the feedback for 5 seconds, participants were given a repetition-detection task for 12 seconds. In this task letters appeared on the screen at the rate of 1 per 1.25 seconds. Participants were instructed to click an onscreen button each time they detected a pair of letters that were the same. The function of this task was to distract the participant from the previous problem and return them to a relatively common neutral state.
Figure 3
Figure 3
Activity in the motor regions associated with the hands. (a) The average BOLD responses for correct regular and exception problems. The dotted lines connect the actual mean responses and show the standard errors of the means. The stars indicate when the responses were submitted. The faded boxcar lines give the average engagement estimated for the Before, Response, and After periods. The solid line given the predicted BOLD response by convolving a hemodynamic response function with the engagement functions. The correlation between observed and predicted BOLD response is displayed. (For the motor region only we assume that engagement begins with the onset of the warning, reflecting anticipatory mouse movement. For other regions, activity is estimated to begin with problem onset.) (b) Mean engagement in Before and After periods as a function of hemisphere, correct versus error, and regular versus exception problems. Arrows connect Before-Regular and After-Exception correct condition that compose the critical contrast in diagnosing Cognitive versus Metacognitive patterns. z in the inset brain slice (radiological convention: image left = participant’s right) is at x=y=0 in Talairach coordinates.
Figure 4
Figure 4
Activity in the lateral inferior prefrontal regions associated with controlled retrieval in the ACT-R theory. (a) BOLD responses in left hemisphere. (b) Mean engagement in left and right hemispheres. See caption of Figure 3 for detail.
Figure 5
Figure 5
Activity in the angular gyrus whose left hemisphere is associated with verbal processing of numbers in the triple-code theory. (a) BOLD responses in right hemisphere. (b) Mean engagement in left and right hemispheres. See caption of Figure 3 for detail.
Figure 6
Figure 6
Activity in premotor regions. (a) BOLD responses in the two right hemisphere regions. (b) Mean engagement in the two left and two right hemispheres. See caption of Figure 3 for detail.
Figure 7
Figure 7
Activity in inferior regions (a) BOLD responses in frontopolar regions. (b) Mean engagement in frontopolar and fusiform regions. See caption of Figure 3 for detail.
Figure 8
Figure 8
(a) Factors 1 and 2 show the rotated scores for the first two factors identified in the factor analysis of the 408 exploratory regions. The Cognitive and Metacognitive Factors are idealized scores that strongly correlated with Factors 1 and 2. (b) Distribution of 51,239 voxels in terms of their correlation with the Cognitive and Metacognitive factors color-coded as to total variance explained. (c) Color coding of categories for 11,994 positively responding voxels with variance explained greater than .841. (d) Brain distribution of voxels in (b) with R2 > .841. Negatively responding voxels are in black and positively responding voxels use the color coding in (c). . The value of z at each brain slice (shown in radiological convention: image left = participant’s right) is at x=y=0 in Talairach coordinates.
Figure 8
Figure 8
(a) Factors 1 and 2 show the rotated scores for the first two factors identified in the factor analysis of the 408 exploratory regions. The Cognitive and Metacognitive Factors are idealized scores that strongly correlated with Factors 1 and 2. (b) Distribution of 51,239 voxels in terms of their correlation with the Cognitive and Metacognitive factors color-coded as to total variance explained. (c) Color coding of categories for 11,994 positively responding voxels with variance explained greater than .841. (d) Brain distribution of voxels in (b) with R2 > .841. Negatively responding voxels are in black and positively responding voxels use the color coding in (c). . The value of z at each brain slice (shown in radiological convention: image left = participant’s right) is at x=y=0 in Talairach coordinates.
Figure 9
Figure 9
Activity in SPFG regions in Figure 8d. (a) BOLD responses in right hemisphere. (b) Mean engagement in left and right hemispheres. See caption of Figure 3 for detail.

Similar articles

Cited by

References

    1. Anderson JR. Human symbol manipulation within an integrated cognitive architecture. Cognitive Science. 2005;29:313–342. - PubMed
    1. Anderson JR. How Can the Human Mind Occur in the Physical Universe? New York: Oxford University Press; 2007.
    1. Anderson JR, Betts S, Ferris JL, Fincham JM. Neural Imaging to Track Mental States while Using an Intelligent Tutoring System. Proceedings of the National Academy of Science USA. 2010;107:7018–7023. - PMC - PubMed
    1. Anderson JR, Bothell D, Byrne MD, Douglass S, Lebiere C, Qin Y. An integrated theory of mind. Psychological Review. 2004;111:1036–1060. - PubMed
    1. Anderson JR, Carter CS, Fincham JM, Ravizza SM, Rosenberg-Lee M. Using fMRI to test models of complex cognition. Cognitive Science. 2008;32:1323–1348. - PubMed

Publication types

MeSH terms

LinkOut - more resources