

Western blotting using capillary electrophoresis
- PMID: 21265514
- PMCID: PMC3075063
- DOI: 10.1021/ac102671n
Western blotting using capillary electrophoresis
Abstract
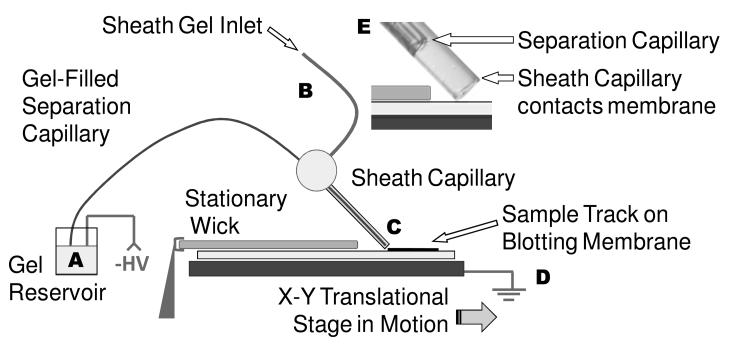
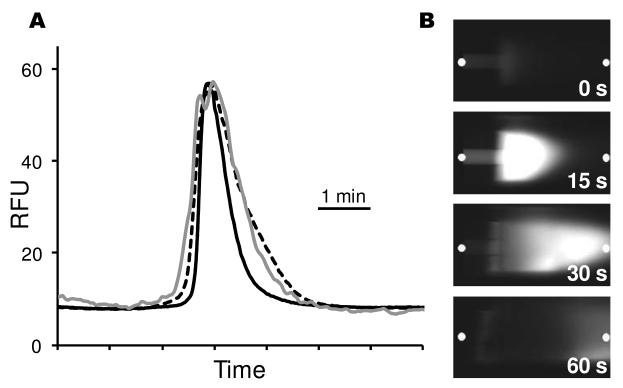
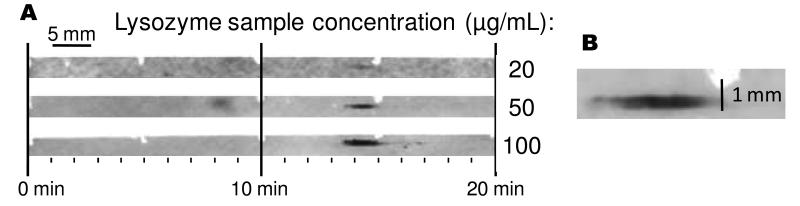
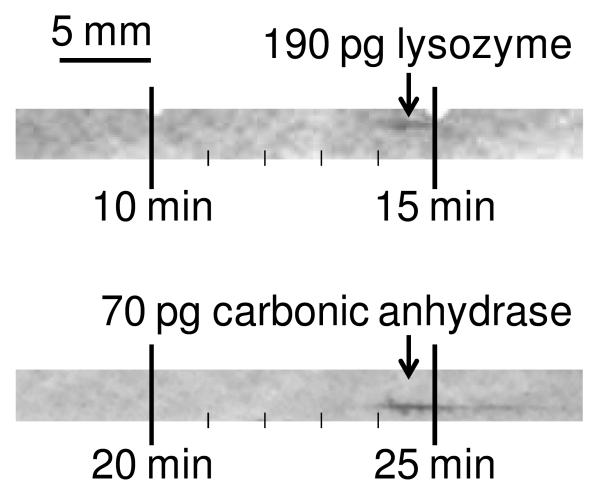
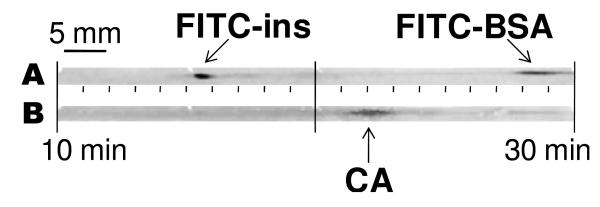
A microscale Western blotting system based on separating sodium-dodecyl sulfate protein complexes by capillary gel electrophoresis followed by deposition onto a blotting membrane for immunoassay is described. In the system, the separation capillary is grounded through a sheath capillary to a mobile X-Y translation stage which moves a blotting membrane past the capillary outlet for protein deposition. The blotting membrane is moistened with a methanol and buffer mixture to facilitate protein adsorption. Although discrete protein zones could be detected, bands were broadened by ∼1.7-fold by transfer to membrane. A complete Western blot for lysozyme was completed in about one hour with 50 pg mass detection limit from low microgram per milliliter samples. These results demonstrate substantial reduction in time requirements and improvement in mass sensitivity compared to conventional Western blots. Western blotting using capillary electrophoresis shows promise to analyze low volume samples with reduced reagents and time, while retaining the information content of a typical Western blot.
Figures

Similar articles
-
High-speed separation of proteins by sodium dodecyl sulfate-capillary gel electrophoresis with partial translational spontaneous sample injection.Electrophoresis. 2011 Oct;32(20):2898-903. doi: 10.1002/elps.201100187. Epub 2011 Sep 16. Electrophoresis. 2011. PMID: 21922502
-
Microfluidic integration of Western blotting is enabled by electrotransfer-assisted sodium dodecyl sulfate dilution.Analyst. 2013 Jan 7;138(1):158-63. doi: 10.1039/c2an36033k. Epub 2012 Oct 8. Analyst. 2013. PMID: 23042290
-
Microchamber Western blotting using poly-L-lysine conjugated polyacrylamide gel for blotting of sodium dodecyl sulfate coated proteins.Anal Chem. 2013 Aug 20;85(16):7753-61. doi: 10.1021/ac401012j. Epub 2013 Aug 5. Anal Chem. 2013. PMID: 23848185
-
Recent developments in capillary zone electrophoresis of proteins.Electrophoresis. 1999 Oct;20(15-16):3106-15. doi: 10.1002/(SICI)1522-2683(19991001)20:15/16<3106::AID-ELPS3106>3.0.CO;2-2. Electrophoresis. 1999. PMID: 10596818 Review.
-
Capillary electrophoresis of proteins for proteomic studies.Electrophoresis. 1999 Oct;20(15-16):3116-21. doi: 10.1002/(SICI)1522-2683(19991001)20:15/16<3116::AID-ELPS3116>3.0.CO;2-0. Electrophoresis. 1999. PMID: 10596819 Review.
Cited by
-
Western blotting using microchip electrophoresis interfaced to a protein capture membrane.Anal Chem. 2013 Jun 18;85(12):6073-9. doi: 10.1021/ac400940x. Epub 2013 May 28. Anal Chem. 2013. PMID: 23672369 Free PMC article.
-
Anti-TNF Withdrawal in Inflammatory Bowel Disease.GE Port J Gastroenterol. 2016 Jan 15;23(3):153-161. doi: 10.1016/j.jpge.2015.11.004. eCollection 2016 May-Jun. GE Port J Gastroenterol. 2016. PMID: 28868451 Free PMC article. Review.
-
Rapid, Multiplexed Phosphoprotein Profiling Using Silicon Photonic Sensor Arrays.ACS Cent Sci. 2015 Oct 28;1(7):374-382. doi: 10.1021/acscentsci.5b00250. Epub 2015 Sep 30. ACS Cent Sci. 2015. PMID: 26539563 Free PMC article.
-
Microfluidic integration for automated targeted proteomic assays.Proc Natl Acad Sci U S A. 2012 Apr 17;109(16):5972-7. doi: 10.1073/pnas.1108617109. Epub 2012 Apr 2. Proc Natl Acad Sci U S A. 2012. PMID: 22474344 Free PMC article.
-
Multiplexed Western Blotting Using Microchip Electrophoresis.Anal Chem. 2016 Jul 5;88(13):6703-10. doi: 10.1021/acs.analchem.6b00705. Epub 2016 Jun 16. Anal Chem. 2016. PMID: 27270033 Free PMC article.
References
-
- Burnette WN. Anal. Biochem. 1981;112:195–203. - PubMed
-
- Gong MJ, Kim BY, Flachsbart BR, Shannon MA, Bohn PW, Sweedler JV. IEEE Sens. J. 2008;8:601–607.
-
- Kurien BT, Scofield RH. Methods. 2006;38:283–293. - PubMed
-
- SNAP i.d. Protein Detection System User Guide. http://www.millipore.com/userguides/tech1/00103871 (accessed July 1, 2010)
Publication types
MeSH terms
Substances
Grants and funding
LinkOut - more resources
Full Text Sources
Other Literature Sources
Miscellaneous
