

Long-term CD4+ T-cell count evolution after switching from regimens including HIV nucleoside reverse transcriptase inhibitors (NRTI) plus protease inhibitors to regimens containing NRTI plus non-NRTI or only NRTI
- PMID: 21266068
- PMCID: PMC3038912
- DOI: 10.1186/1471-2334-11-23
Long-term CD4+ T-cell count evolution after switching from regimens including HIV nucleoside reverse transcriptase inhibitors (NRTI) plus protease inhibitors to regimens containing NRTI plus non-NRTI or only NRTI
Abstract
Background: Data regarding CD4+ recovery after switching from protease inhibitor (PI)-based regimens to regimens not containing PI are scarce.
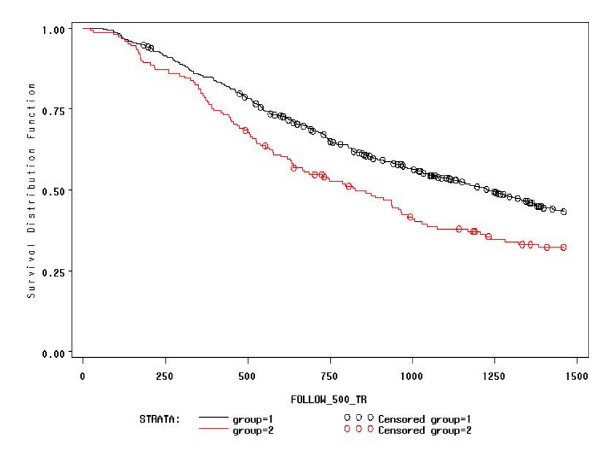
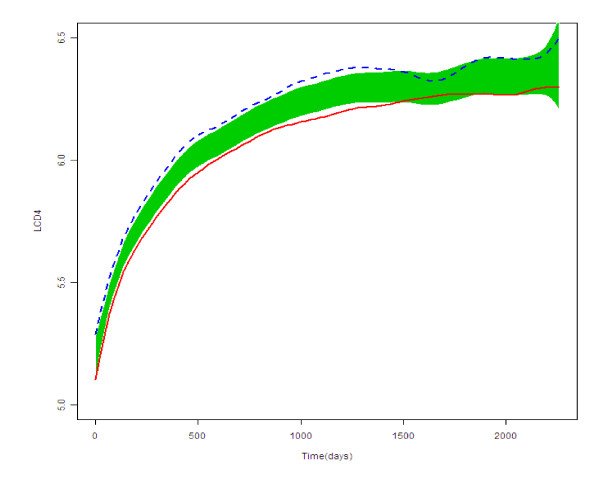
Methods: Subjects with virological success on first-PI-regimens who switched to NNRTI therapy (NNRTI group) or to nucleoside reverse transcriptase (NRTI)-only (NRTI group) were studied. The effect of the switch on the ongoing CD4+ trend was assessed by two-phase linear regression (TPLR), allowing us to evaluate whether a change in the CD4+ trend (hinge) occurred and the time of its occurrence. Furthermore, we described the evolution of the frequencies in CD4-count classes across four relevant time-points (baseline, before and immediately after the switch, and last visit). Finally, we explored whether the CD4+ counts evolved differently in patients who switched to NNRTI or NRTI-only regimens by considering: the overall CD4+ trends, the time to CD4+≥ 500/mm3 after the switch, and the area-under-the-curve (AUC) of the CD4+ after the switch.
Results: Eight hundred and ninety-six patients, followed for a median of 2,121 days, were included. At TPLR, hinges occurred in 581/844 (68.9%), but in only 40/581 (6.9%) within a time interval (180 days) compatible with a possible relationship to the switch; furthermore, in 19/40 cases, CD4+ counts appeared to decrease after the hinges. In comparison with the NNRTI group, the NRTI group showed CD4+ count greater at baseline (P = 0.0234) and before the switch (P ≤ 0.0001), superior CD4+ T-cell increases after HAART was started, lower probability of not achieving CD4+ ≥ 500/mm3 (P = 0.0024), and, finally, no significant differences in the CD4+ T-cell AUC after the switch after adjusting for possible confounders (propensity score and pre-switch AUC). Persistence at CD4+ < 200/mm3 was observed in 34/435 (7.5%) patients, and a decrease below this level was found in only 10/259 (3.9%) with baseline CD4+ ≥ 350/mm3.
Conclusions: Switching from first-line PI to NNRTI- or NRTI-based regimens did not seem to impair CD4+ trend over long-term follow-up. Although the greater CD4+ increases in patients who switched to the NRTI-only regimen was due to higher CD4+ counts before the switch, several statistical analyses consistently showed that switching to this regimen did not damage the ongoing immune-reconstitution. Lastly, the observation that CD4+ T-cell counts remained low or decreased in the long term despite virological success merits further investigation.
Figures
References
-
- Dronda F, Moreno S, Moreno A, Casado JL, Perez-Elias MJ, Antela A. Long-term outcomes among antiretroviral naive human immunodeficiency virus infected patients with small increases in CD4+ cell counts after successful virologic suppression. Clin Infect Dis. 2002;35:1005–1009. doi: 10.1086/342695. - DOI - PubMed
Publication types
MeSH terms
Substances
LinkOut - more resources
Full Text Sources
Medical
Research Materials
Miscellaneous
