. 2011 Feb 15;124(Pt 4):635-46.
doi: 10.1242/jcs.067579. Epub 2011 Jan 25.

Punctuated actin contractions during convergent extension and their permissive regulation by the non-canonical Wnt-signaling pathway

Affiliations

Punctuated actin contractions during convergent extension and their permissive regulation by the non-canonical Wnt-signaling pathway

Hye Young Kim et al. J Cell Sci. .

Abstract

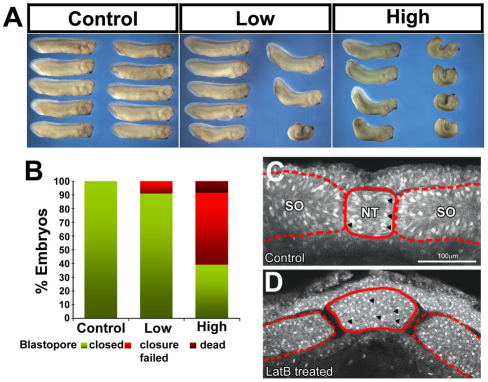
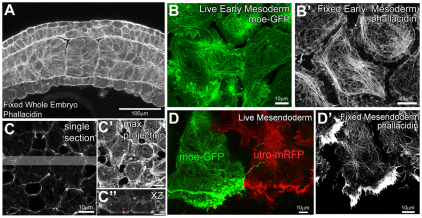
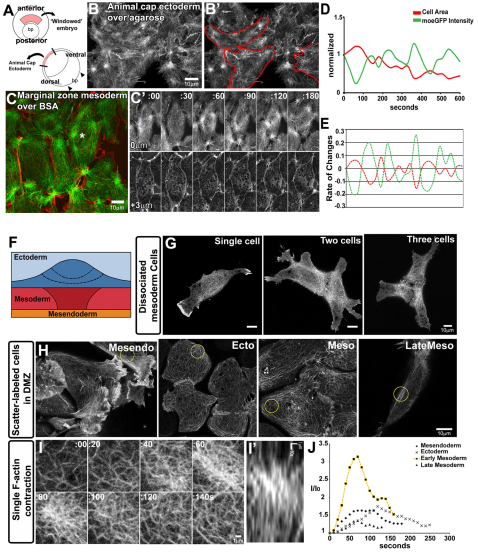
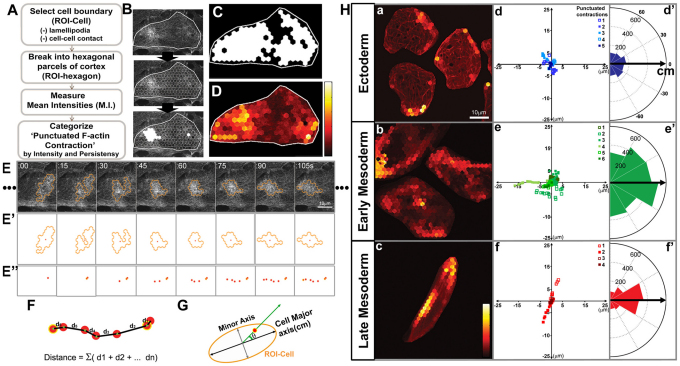
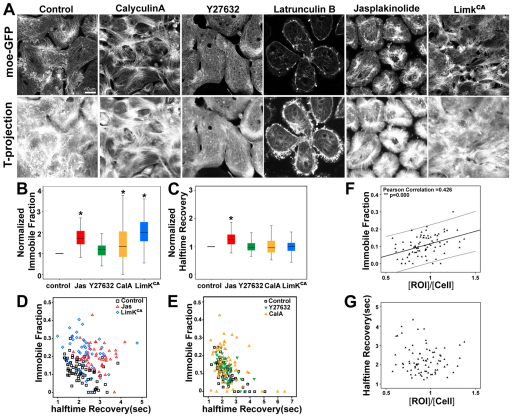
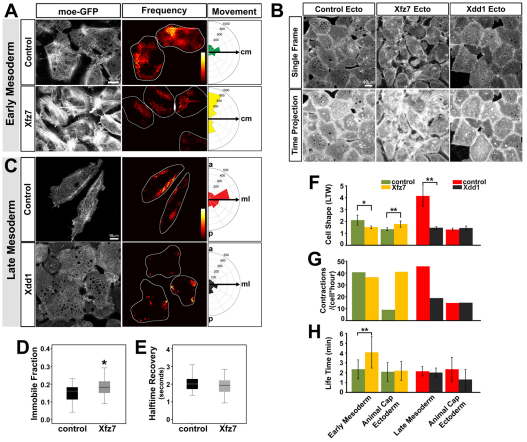
Actomyosin networks linked to the micro-environment through the plasma membrane are thought to be key players in regulating cell behaviors within multicellular tissues, such as converging and extending mesoderm. Here, we observe the dynamics of actin contractions called 'punctuated actin contractions' in the mid-cell body of embryonic mesenchymal cells in the mesoderm. These contraction dynamics are a common feature of Xenopus embryonic tissues and are important for cell shape changes during morphogenesis. Quantitative morphological analysis of these F-actin dynamics indicates that frequent and aligned movements of multiple actin contractions accompany mesoderm cells as they intercalate and elongate. Using inhibitors combined with fluorescence recovery after photobleaching (FRAP) analysis, we find that the dynamics of actin contractions are regulated by both myosin contractility and F-actin polymerization. Furthermore, we find that the non-canonical Wnt-signaling pathway permissively regulates levels of punctuated actin contractions. Overexpression of Xfz7 (Fzd7) can induce early maturation of actin contractions in mesoderm and produce mesoderm-like actin contractions in ectoderm cells. By contrast, expression of the dominant-negative Xenopus disheveled construct Xdd1 blocks the progression of actin contractions into their late mesoderm dynamics but has no effect in ectoderm. Our study reveals punctuated actin contractions within converging and extending mesoderm and uncovers a permissive role for non-canonical Wnt-signaling, myosin contractility and F-actin polymerization in regulating these dynamics.


Figures

Fig. 1.
Fig. 1.
Transient actin depolymerization results in failure of convergent extension. (A) Xenopus laevis embryos were transiently treated for 20 minutes during gastrulation with low (0.6 μM) or high (1.2 μM) concentrations of LatB. LatB was washed out and whole embryos were cultured until they reached the tadpole stages. Embryos exposed to a pulse of LatB during mid-gastrulation developed with a short and bent axis in a dose-dependent manner. (B) Blastopore closure defects increase with the concentration of LatB. (C) Transverse-sectioned dorsal tissue of control embryos show ordered positioning of nuclei within two cell layers in mesoderm (arrowheads). (D) Three hours after the LatB pulse and wash, dorsal tissue has randomly positioned rounded cells in multiple layers that thicken both the ectoderm and mesoderm. Cell shapes are visualized by rhodamine–dextran injection at the single-cell stage. SO, somite; NT, notochord.
Fig. 2.
Fig. 2.
Cortical actin cytoskeleton. (A) Maximum intensity projection of 10-μm thick confocal volumes (20 sections at 0.5 μm intervals) of F-actin stained with phallacidin from a transverse-sectioned whole embryo fixed at stage 12. (B) Single confocal image of live early mesoderm cells (at stage 10.5) expressing moe–GFP. (B′) A single confocal section of F-actin in fixed early mesoderm cells stained with phallacidin. (CC″) A single confocal section of F-actin within the mid-cell body (C), within fixed animal cap ectoderm stained with phallacidin. (C′) Maximum intensity projection of 3-μm-thick confocal volume collected through the basolateral F-actin cortex. (C″) xz-projection showing the lateral F-actin cortex within a 23-μm-thick confocal volume from the shaded region of C. The red arrowheads in C″ indicate dense F-actin networks within the basolateral actin cortex. (D) Single confocal image of live mesendoderm cells expressing moe–GFP and utrophin–mRFP. Each cell is the product of a scatter-labeled patch of mRNA-injected cells. The surrounding cells are unlabeled. (D′) The F-actin network in fixed mesendoderm cells stained with phallacidin.
Fig. 3.
Fig. 3.
Punctuated F-actin contractions regulate cell shape. (A) A schematic of the gastrula from the vegetal view (left) and sagittal view (right). bp, blastopore. Mesoderm cells (pink) are exposed by removing the epithelial sheet from the embryo, to give the ‘windowed embryo’, in order to observe the dynamics of cells and F-actin (as shown in C). Confocal images from a time-lapse movie of moe–GFP-expressing animal cap ectoderm on agarose (B,B′) and marginal zone mesoderm from the windowed embryo (C,C′). Confocal sections were taken at two depths, either for the F-actin cortex (green) or for the cell outline (red), in order to capture the dynamics of both cell behaviors and F-actin. C′ shows images from the time-lapse movie of the marked cell in C. (D) The cell area is inversely correlated with the moe–GFP intensity from the cell (results are from the marked cell in C). As the area of the cell decreases (or cells contract their body), the moe–GFP intensity increases (the F-actin network gets tensed). (E) The mean cross-correlation coefficient for the rate of changes between the cell area and the moe–GFP intensity is −0.76 (12 cells from three time-lapse movies). (F) A fate map of the marginal zone explant. (G,H) Confocal images of moe–GFP from dissociated mesoderm cells and cells in the dorsal marginal zone (DMZ) tissue, including mesendoderm, ectoderm, early mesoderm and late mesoderm cells. (I) A time series of confocal images of a single cortical F-actin contraction within an early mesoderm cell. (I′) Kymograph of intensities through the mid-line of the same contraction as in (I). (J) Moe–GFP intensity profiles in the circular region of (B–D) for one episode of F-actin contraction shown as the normalized intensity (I/I0; I0 is initial intensity) within a circular region of each cell type (yellow circles in the scatter-labeled cells in H) over a single contraction.
Fig. 4.
Fig. 4.
Quantitative analysis of contraction morphology. (A) Flow-chart for the image-processing steps used to identify the contractile actin cortex and categorize the individual punctuated F-actin contraction. (B) The identifying steps applied on a live-cell moe–GFP confocal image of an anterior mesoderm cell. The cell boundary of the selected cell (ROI-Cell) is shown with a white line, which is divided into hexagonal parcels (ROI-hexagon). White-filled ROI-hexagons are the identified ROI-hexagons containing ‘active’ actin cortex. (C) The contractile area displays the region where a contractile F-actin cortex was present in at least a single frame during the 30 minutes. (D) The incident frequency of F-actin contractions in each ROI-hexagon is shown by the F-actin frequency map. A 30-minute time-lapse was used for C and D. (E) A time-lapse movie following moe–GFP identifing punctuate F-actin contractions. (E′–E″) The identified positions (red dots) of the center of intensity of a categorized actin contraction enclosed by the hexagonal area. (F) The distance of movements is the sum of segmented distances for one episode of an F-actin contraction. (G) Anglular distributions of the positions of F-actin contractions with respect to the major cell (cm) axis represented by angle θ. (H) (a–c) F-actin frequency maps from a confocal time-lapse movie of moe–GFP-expressing ectoderm (a), early mesoderm (b), and late mesoderm (c) cells. (d–f) Scatter plots display relative movement vectors of F-actin contractions from one representative cell starting from its origin (0,0). (d′–f′) Circular histograms represent the angular distribution of the punctuate F-actin contractions with respect to the cell major axis. (see G for the method: the major cell axis is set to 0, the angle between the F-actin contraction and the major cell axis is θ). The heat-map colors in (D) and (H) indicate an arbitrary frequency scale from high frequency or high persistence ‘light’ to low frequency or low persistence ‘dark’ (see supplementary material Tables S1 and S2 for a summary of the quantified punctuated F-actin contractions).
Fig. 5.
Fig. 5.
Formation of punctuated F-actin contractions on perturbation of myosin contractility and filamentous actin kinetics. (A) Confocal images from a representative time-lapse sequence of moe–GFP-expressing early mesoderm cells treated with 50 nM CalA, 50 μM Y27632, 0.6 μM LatB, 5 μM Jas or expressing LimKCA. The maximum projection of the time-series of moe–GFP shows the overall levels of F-actin dynamics for 10 minutes during early gastrulation. (B) The immobile fraction (*P<0.001, 56 control and 46 Jas-treated cells) and (C) halftime recovery (*P<0.001, 56 control and 46 Jas-treated cells) are significantly higher in Jas-treated cells than in control cells. (D) Jas-treated cells have significantly higher values for the halftime recovery and immobile fraction compared with control cells. (E) Both Y27632- or CalA-treated cells have similar ranges for both immobile fraction and halftime recovery compared with control cells. (F) The F-actin-rich cortex has a higher immobile fraction after photobleaching within control cells. The x-axis represents the ratio of moe–GFP intensity in the bleached region to the intensity over the entire cell before photobleaching. For control cells, the pre-bleach intensity levels of the bleach area are positively correlated with the immobile fraction [Pearson correlation=0.426 (a slope with 95% confidence interval); **P<0.001, 82 control cells], but shows no correlation with the halftime recovery (G). Note that the immobile fractions (B) and time recovery (C) were normalized to controls in order to compare the different treatments. Raw values for are shown in (D) and (E).
Fig. 6.
Fig. 6.
Punctuated F-actin contractions are modulated by non-canonical Wnt-signaling. The dynamics of punctuated F-actin contractions are compared in cells where non-canonical signaling is reduced by Xdd1 or where signaling is stimulated by Xfz7. (A) Punctuated F-actin contractions in moe–GFP-expressing early mesoderm cells (control and Xfz7-expressing cells) exhibit different patterns of frequency and direction of the movements (cm, cell major axis). Note that the calculated orientation of punctuated F-actin contractions from round cells, such as Xfz7-expressing cells (LTW 1.51±0.22) (see supplementary material Tables S1 and S2) are not meaningful when compared with the contraction orientations in elongated cells, such as the late mesoderm cells in (C) (LTW 4.13±1.72). (B) Animal cap ectoderm cells expressing moe–GFP (control, and Xfz7- or Xdd1-expressing cells) and maximum projection of 10-minute time-lapse sequences. (C) Punctuated F-actin contractions in moe–GFP-expressing late mesoderm cells (control and Xdd1-expressing cells) exhibit different patterns of frequency and direction of the movements. ml, mediolateral axis. (D,E) Xfz7-expressing early mesoderm cells have a significantly high immobile fraction than in control cells. (FH) Quantified results of cell shape, rate and the lifetime of punctuated F-actin contractions from Xfz7- or Xdd1-expressing cells. *P<0.05; ** P<0.01 (see supplementary material Tables S2 and S3). The heat-map colors in (A) and (C) indicate an arbitrary frequency scale from high frequency or high persistence ‘light’ to low frequency or low persistence ‘dark’.

References

    1. Abramoff M. D., Magelhaes P. J., Ram S. J. (2004). Image processing with ImageJ. Biophotonics International 11, 36-42
    1. Amato P. A., Taylor D. L. (1986). Probing the mechanism of incorporation of fluorescently labeled actin into stress fibers. J. Cell Biol. 102, 1074-1084 - PMC - PubMed
    1. Axelrod D., Koppel D. E., Schlessinger J., Elson E., Webb W. W. (1976). Mobility measurement by analysis of fluorescence photobleaching recovery kinetics. Biophys. J. 16, 1055-1069 - PMC - PubMed
    1. Benink H. A., Bement W. M. (2005). Concentric zones of active RhoA and Cdc42 around single cell wounds. J. Cell Biol. 168, 429-439 - PMC - PubMed
    1. Blalock H. M. (1972). Social Statistics. New York: McGraw-Hill;

Publication types