. 2011 Feb 8;108(6):2617-22.
doi: 10.1073/pnas.1019217108. Epub 2011 Jan 25.

Changes in 24-nt siRNA levels in Arabidopsis hybrids suggest an epigenetic contribution to hybrid vigor

Affiliations

Changes in 24-nt siRNA levels in Arabidopsis hybrids suggest an epigenetic contribution to hybrid vigor

Michael Groszmann et al. Proc Natl Acad Sci U S A. .

Abstract

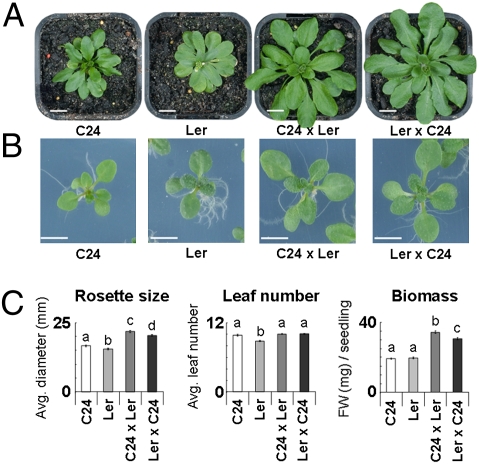
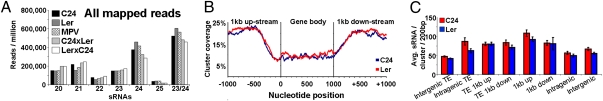
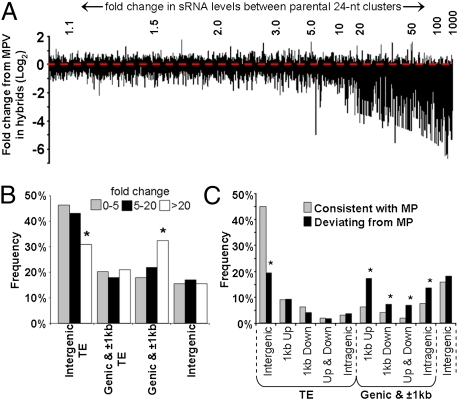
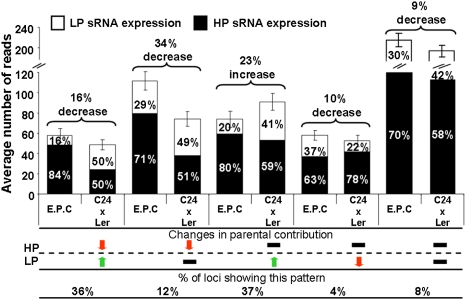
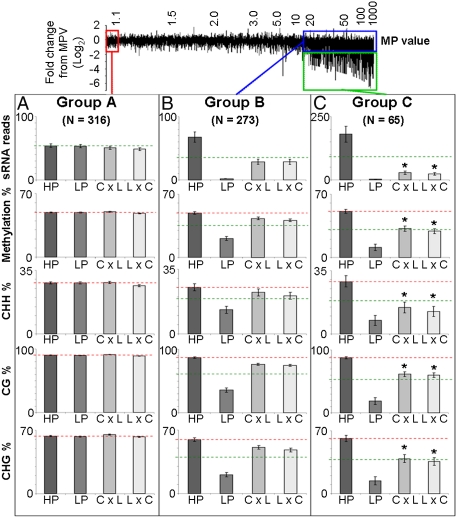
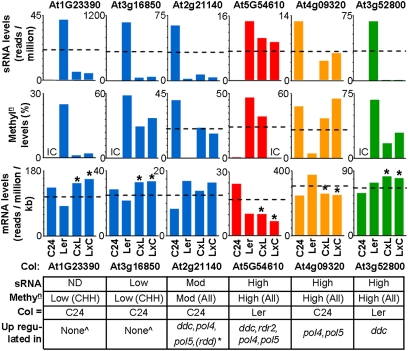
Intraspecific hybrids between the Arabidopsis thaliana accessions C24 and Landsberg erecta have strong heterosis. The reciprocal hybrids show a decreased level of 24-nt small RNA (sRNA) relative to the parents with the decrease greatest for those loci where the parents had markedly different 24-nt sRNA levels. The genomic regions with reduced 24-nt sRNA levels were largely associated with genes and their flanking regions indicating a potential effect on gene expression. We identified several examples of genes with altered 24-nt sRNA levels that showed correlated changes in DNA methylation and expression levels. We suggest that such epigenetically generated differences in gene activity may contribute to hybrid vigor and that the epigenetic diversity between ecotypes provides increased allelic (epi-allelic) variability that could contribute to heterosis.


Conflict of interest statement

The authors declare no conflict of interest.

Figures

Fig. 1.
Fig. 1.
(A) Vegetative heterosis of 4-wk-old F1 hybrids. (Scale bar, 10 mm.) (B and C) Hybrids of C24 and Ler show clear heterosis as early as 14–15 d after sowing. (Scale bar, 5 mm.) Error bars indicate SEM. FW, fresh weight. Lettering above each bar indicates statistical differences (t test, P ≤ 0.05). No. of seedlings: C24, 74; Ler, 71; C24 × Ler 71; and Ler × C24 72.
Fig. 2.
Fig. 2.
(A) sRNAs (20- to 25-nt) from total mapped population. An additional category (23/24-nt) was added, as these two classes likely represent a single class, generated at similar loci through identical biogenesis pathway, exerting similar downstream effects (16). (B and C) siRNA frequency and density over genes associated with siRNA clusters. (B) Probability of a given nucleotide being covered by a 24-nt siRNA cluster (gene body incorporates 5′ and 3′ UTR; position 0 indicates transcriptional start site). Only genes ≥1 kb were considered. All genes and respective coverage is scaled to 1 kb for parity. (C) Average siRNAs per cluster for a genomic feature (standardized to 200 bp, i.e., average cluster length). “TE 1kb up- or down-stream” is a TE situated within ±1 kb of a gene. Intergenic TEs are transposable elements residing at least ±1 kb from a gene. Error bars represent SEM.
Fig. 3.
Fig. 3.
(A) Deviation of C24 × Ler hybrid siRNA values around the expected MPV. All 14,175 parentally derived 24-nt siRNA clusters are ranked left to right along the x axis, based on fold differences in siRNA levels between parents. The x-axis line itself represents MPV (red dotted line) with the vertical bars depicting log2 fold-change deviation from MPV in the hybrid (y axis). Ler × C24 hybrid has an almost identical pattern. (B) Profile of parental 24-nt siRNA clusters grouped based on fold differences between parental siRNA levels. (C) Genomic profile of clusters consistent with MPV (13,547) and those significantly deviating from MPV (628). *Significantly different (Fisher exact test, P < 0.01); Up, 1 kb upstream; Down, 1 kb downstream.
Fig. 4.
Fig. 4.
A total of 97% of the transaffected loci categorized into five classes based on changed parental contributions in the hybrid. A siRNA locus can be up-regulated (1.5-fold), down-regulated (1.5-fold), or unaltered (within 1.5-fold of expected value) within the hybrid. The “expected parental contribution” (E.P.C) bars equal total siRNA levels that should be produced (bars represent SEM), with the relative contributions from high parent (HP; black) and low parent (LP; white). Ler × C24 is similar (Fig. S8B). Relative difference of average values located above parentheses.
Fig. 5.
Fig. 5.
DNA methylation levels associated with 24-nt siRNA clusters. Three distinct groups of clusters were examined. (A) Red box indicates no difference between parental or hybrid siRNA levels. (B) Blue box indicates large difference between parents but hybrids are near MPV. (C) Green box indicates large differences between parents and hybrids are significantly below MPV. C, C24; HP, high parent; L, Ler; LP, low parent. Red dotted line represents HP average; green dotted line represents MPV. Error bars represent SEM. The y axes are linear scale. *Significantly below values in group B (P ≤ 0.05).
Fig. 6.
Fig. 6.
siRNA and methylation levels in hybrids associated with changes in gene expression. siRNA clusters are located within 1 kb upstream (At16850, At5g54610, At4g09320, and At3g52800) or downstream (At1g23390 and At2g21140). Table details sRNA and Methyl-C levels at the homologous gene in the Columbia accession (Col) matching the Col epi-allele to the C24 or Ler epi-allele. Bottom row indicates whether gene expression is altered in Col RdDM or DNA demethylation mutants. Examples cover four classes (color coded) based on changes in siRNAs and resulting gene activity in hybrids. ^Not expected to be altered in epigenetic mutants, as both C24 and Col alleles are not associated with substantial levels of siRNA or methylation. *At2g21140 down-regulated in hypermethylated Col ros1 demeter-like 2 demeter-like 3 (rdd) triple mutant. IC, insufficient coverage to determine methylation level; ND, not detected. *mRNA levels significantly different from MPV (P ≤ 0.05). References to Col data provided in SI Materials and Methods. qRT-PCR performed on three of six genes (Fig. S8C); consistent with mRNA-seq dataset used in this analysis.

References

    1. Shull GH. Beginnings of the heterosis concept. In: Gowan JW, editor. Heterosis. Ames, IA: Iowa State College Press; 1952. pp. 14–48.
    1. Chen ZJ. Molecular mechanisms of polyploidy and hybrid vigor. Trends Plant Sci. 2010;15:57–71. - PMC - PubMed
    1. Hochholdinger F, Hoecker N. Towards the molecular basis of heterosis. Trends Plant Sci. 2007;12:427–432. - PubMed
    1. Lippman ZB, Zamir D. Heterosis: Revisiting the magic. Trends Genet. 2007;23:60–66. - PubMed
    1. Meyer RC, et al. QTL analysis of early stage heterosis for biomass in Arabidopsis. Theor Appl Genet. 2010;120:227–237. - PMC - PubMed

Publication types

MeSH terms

Associated data