. 2011 May;10(5):M110.003988.
doi: 10.1074/mcp.M110.003988. Epub 2011 Jan 25.

mzServer: web-based programmatic access for mass spectrometry data analysis

Affiliations

mzServer: web-based programmatic access for mass spectrometry data analysis

Manor Askenazi et al. Mol Cell Proteomics. 2011 May.

Abstract

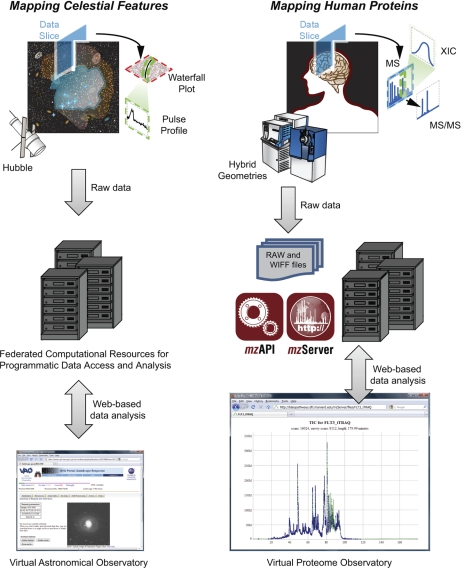
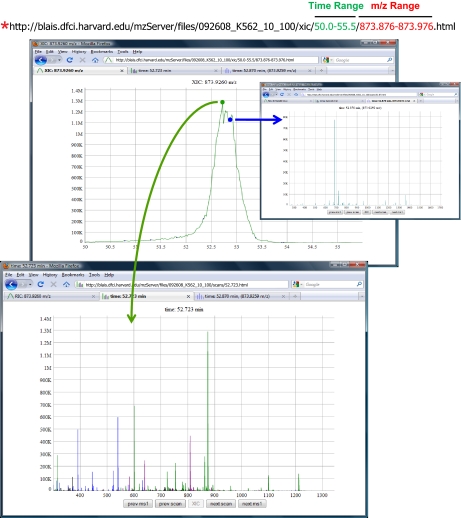
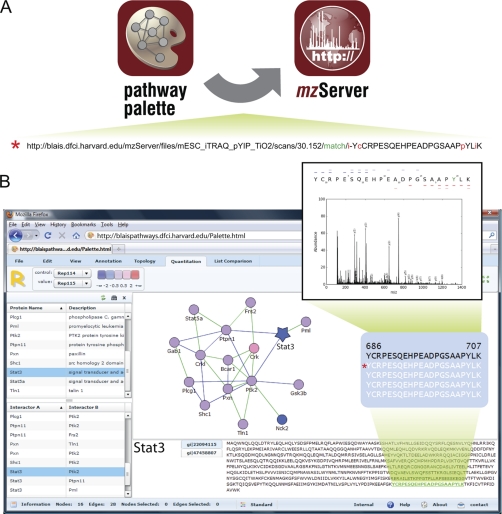
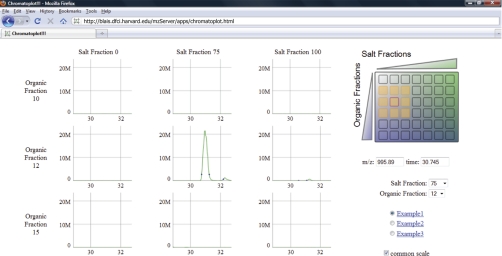
Continued progress toward systematic generation of large-scale and comprehensive proteomics data in the context of biomedical research will create project-level data sets of unprecedented size and ultimately overwhelm current practices for results validation that are based on distribution of native or surrogate mass spectrometry files. Moreover, the majority of proteomics studies leverage discovery-mode MS/MS analyses, rendering associated data-reduction efforts incomplete at best, and essentially ensuring future demand for re-analysis of data as new biological and technical information become available. Based on these observations, we propose to move beyond the sharing of interpreted spectra, or even the distribution of data at the individual file or project level, to a system much like that used in high-energy physics and astronomy, whereby raw data are made programmatically accessible at the site of acquisition. Toward this end we have developed a web-based server (mzServer), which exposes our common API (mzAPI) through very intuitive (RESTful) uniform resource locators (URL) and provides remote data access and analysis capabilities to the research community. Our prototype mzServer provides a model for lab-based and community-wide data access and analysis.


Figures

Fig. 1.
Fig. 1.
Data from astronomy (left) and proteomics (right) have complex, multidimensional structures. The field of astronomy has successfully transitioned to a point whereby programmatic access and visualization via web-based computational resources (bottom, left) has de-coupled data analysis from the site of physical data storage (10, 11). We propose that the field of proteomics is nearing a similar threshold (bottom, right) and have therefore implemented mzServer, a web-based resource that utilizes simple, RESTful URLs to access native mass spectrometry data files via mzAPI (1).
Fig. 2.
Fig. 2.
Extracted ion chromatograms (XICs) are generated from human-readable URLs (red asterisk, top) that can be modified manually or programmatically. The numbers in green represent the LC elution time in minutes and the numbers in red represent the mass range. XICs are decorated with circles that indicate associated MS (green) and MS/MS (blue) scans. A left mouse click displays the associated MS/MS spectrum in a new browser tab (blue arrow and right inset panel). Clicking on all other datapoints in the XIC displays the associated MS scan (green arrow and bottom panel), in which precursors are color-coded by charge state.
Fig. 3.
Fig. 3.
Integration of mzServer URLs in other bioinformatic resources. (A) mzServer is readily integrated with other web-based resources such as Pathway Palette (14). (B) Detected proteins are represented as nodes and arranged based on previously reported protein-protein interactions to yield a biological pathway. Nodes are color-coded based on iTRAQ ratios that represent dynamic regulation of phosphorylation resulting from cytokine withdrawal (13). Selection of a protein (STAT3, blue star) shows the sequence and detected peptide evidence (YCRPESQEHPEADPGSAAPpYLK). A left mouse click on an identified peptide sends a URL (red asterisk) to the mzServer to reveal the associated MS/MS spectrum with the amino acid sequence annotated according to the b- (blue dashes) and y- (red dashes) type fragment ions detected (lighter shades of blue and red correspond to doubly-charged fragment ions). Users can easily test alternative hypotheses for peptide sequence assignment and modification state by editing the associated URL.
Fig. 4.
Fig. 4.
mzServer provides an intuitive URL-based API for mass-informatics that enables rapid creation of interactive data viewers. Chromatoplot allows rapid and convenient evaluation of separation peak capacity for multi-dimension fractionation schemes. A 7 × 6 grid (top, right) encompasses 42 fractions separated in three dimensions. Selection of one fraction (red outline) along with a precursor m/z value and retention time (middle, right) displays XICs for the designated mass-to-charge range in the selected and neighboring fractions.

References

    1. Askenazi M., Parikh J. R., Marto J. A. (2009) mzAPI: a new strategy for efficiently sharing mass spectrometry data. Nat. Methods 6, 240–241 - PMC - PubMed
    1. Cottingham K. (2009) MCP ups the ante by mandating raw-data deposition. J. Proteome Res. 8, 4887–4888 - PubMed
    1. Chalkley R. J., Clauser K. R., Carr S. A. (2009) Updating the MCP proteomic publication guidelines. ASBMB Today, August, 16–18
    1. Falkner J., Andrews P. C. (2006) The DFS tool for dissemination and annotation of proteomics data. HUPO. 5th Annual World Congress p. 98, Long Beach, CA U.S.A
    1. Mead J. A., Bianco L., Bessant C. (2009) Recent developments in public proteomic MS repositories and pipelines. Proteomics 9, 861–881 - PubMed

Publication types

Substances

LinkOut - more resources