. 2011 Jan;23(1):350-63.
doi: 10.1105/tpc.110.080150. Epub 2011 Jan 25.

Two distinct roles of ARABIDOPSIS HOMOLOG OF TRITHORAX1 (ATX1) at promoters and within transcribed regions of ATX1-regulated genes

Affiliations

Two distinct roles of ARABIDOPSIS HOMOLOG OF TRITHORAX1 (ATX1) at promoters and within transcribed regions of ATX1-regulated genes

Yong Ding et al. Plant Cell. 2011 Jan.

Abstract

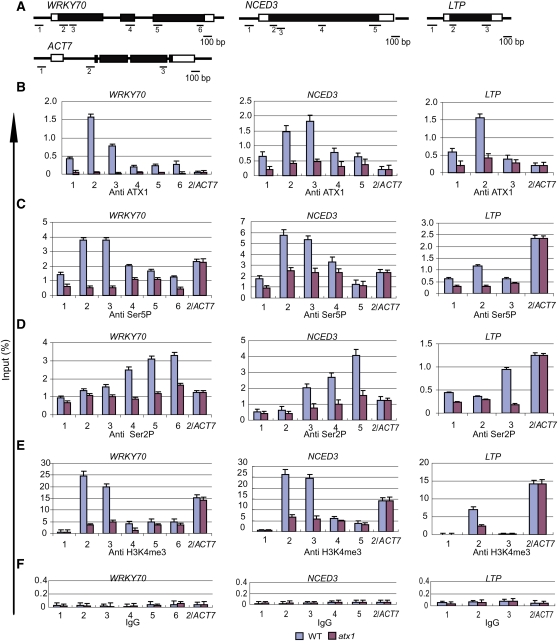
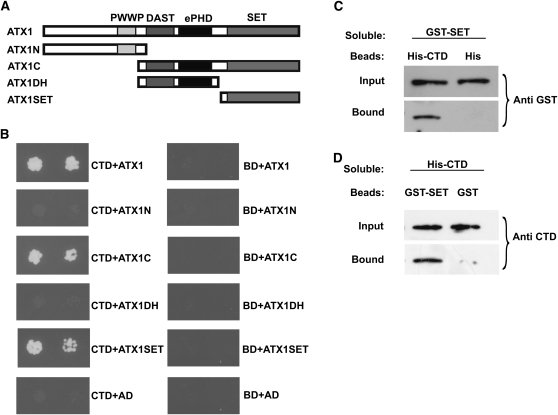
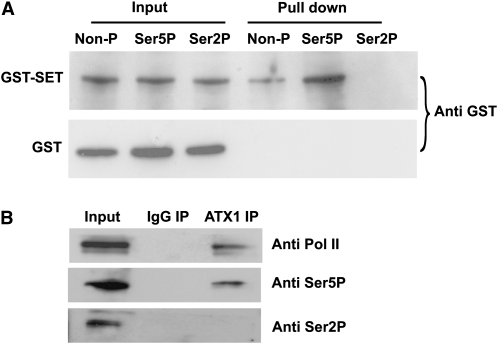
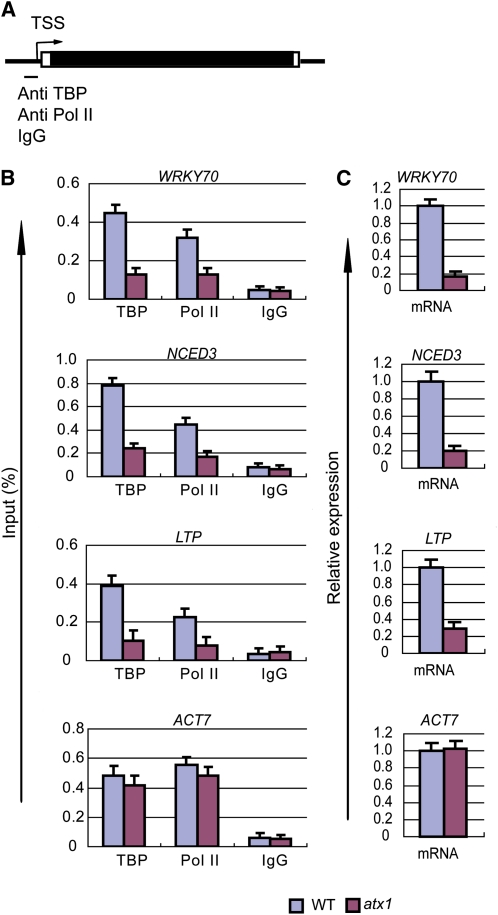
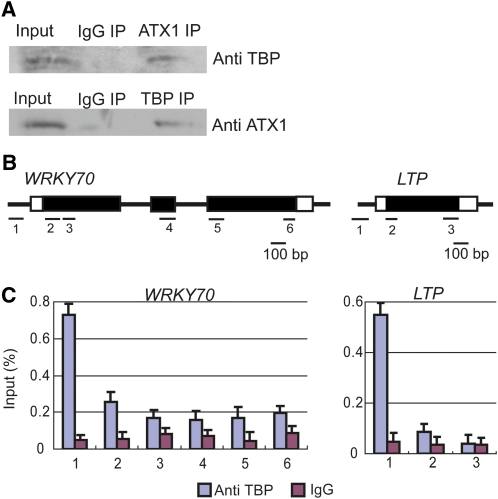
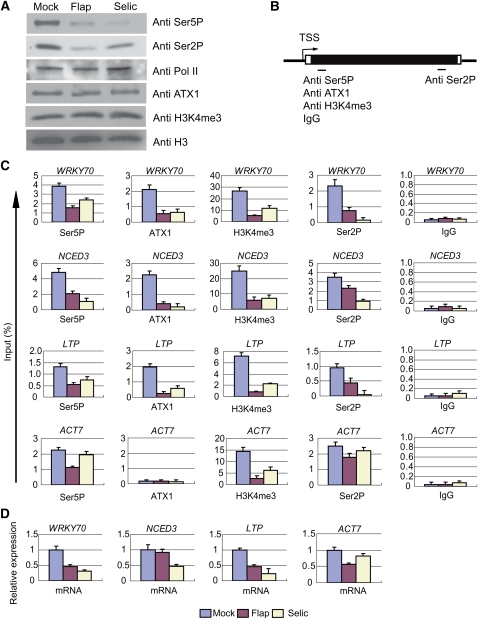
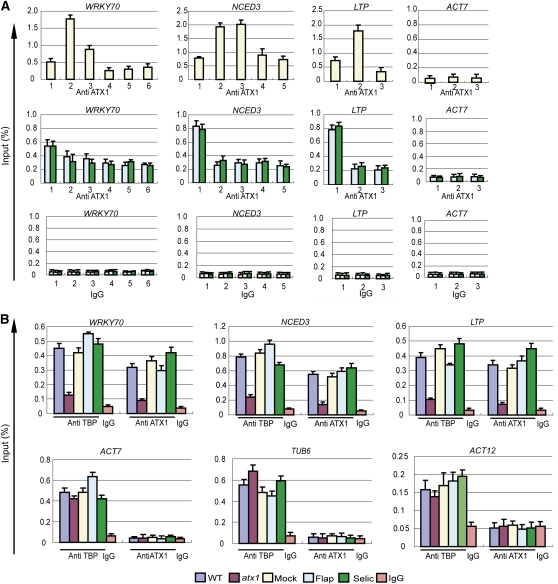
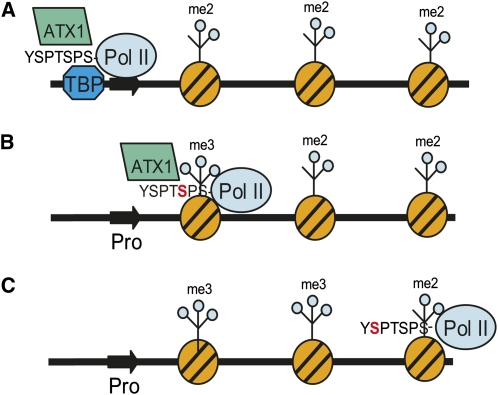
The Arabidopsis thaliana trithorax-like protein, ATX1, shares common structural domains, has similar histone methyltransferase (HMT) activity, and belongs in the same phylogenetic subgroup as its animal counterparts. Most of our knowledge of the role of HMTs in trimethylating lysine 4 of histone H3 (H3K4me3) in transcriptional regulation comes from studies of yeast and mammalian homologs. Little is known about the mechanism by which ATX1, or any other HMT of plant origin, affects transcription. Here, we provide insights into how ATX1 influences transcription at regulated genes, playing two distinct roles. At promoters, ATX1 is required for TATA binding protein (TBP) and RNA Polymerase II (Pol II) recruitment. In a subsequent event, ATX1 is recruited by a phosphorylated form of Pol II to the +300-bp region of transcribed sequences, where it trimethylates nucleosomes. In support of this model, inhibition of phosphorylation of the C-terminal domain of Pol II reduced the amounts of H3K4me3 and ATX1 bound at the +300-nucleotide region. Importantly, these changes did not reduce the occupancy of ATX1, TBP, or Pol II at promoters. Our results indicate that ATX1 affects transcription at target genes by a mechanism distinct from its ability to trimethylate H3K4 within genes.


Figures

Figure 1.
Figure 1.
Distribution of ATX1, Ser5P, and Ser2P of the CTD of Pol II and H3K4me3 on ATX1-Regulated Genes. (A) Schematic diagrams of the WRKY70, NCED3, LTP, and ACT7 genes. Within the transcribed region of each gene, the 5′ or 3′ untranslated regions are shown as open boxes, the exons as black boxes, and the introns as thin black lines. The locations of the gene regions analyzed by ChIP-PCR are shown below each gene, and the corresponding sequences are in Supplemental Table 2 online. Region 1 is in the promoter region of each gene. (B) to (F) The amounts of ATX1, the phosphorylated forms (Ser5P or Ser2P) of the CTD of Pol II, H3K4me3, or nonspecific binding of control IgG serum (IgG) at different regions of the genes were determined by ChIP-PCR. The gene regions analyzed by quantitative PCR are indicated on the x axis, and the DNA enrichment on the y axis is relative to the input DNA. ACT7 is not regulated by ATX1. The region analyzed for this gene corresponds to region 2 (2/ACT7), and data from the analyses were included in the profiles for each gene as an internal control. Experiments were repeated at least three times, each with three replicates, and the representative experiments shown indicate the mean + se, n = 3 replicates. WT, wild type. [See online article for color version of this figure.]
Figure 2.
Figure 2.
ATX1 Interacts with the CTD of Pol II. Yeast two-hybrid or in vitro interaction assays were performed. (A) The different regions of ATX1 containing the indicated domains (PWWP, DAST, ePHD, and SET) that were tested in yeast two-hybrid analyses are shown. (B) The DNA binding domain (BD) or BD-CTD fusions (CTD) were tested for binding to the activation domain (AD) fused to the various ATX1 domains shown in (A). The growth of two dilutions (4 × 10⁻³ and 8 × 10⁻⁴) of the yeast culture on SD medium lacking Trp, Leu, His, and adenine is shown. (C) and (D) Representative immunoblots of the input amounts of a soluble protein or the amount of this protein bound to beads containing a surface-bound control tag or a tag fusion protein. The soluble protein being tested is denoted at the top of each panel. (C) Beads containing a His tag (His) or a His tag fused to the CTD of Pol II (His-CTD) were assayed for their ability to bind a soluble GST fusion to the SET domain of ATX1 (GST-SET). Input or bound protein was detected with antibody to GST (Anti GST). (D) Beads containing a GST tag or a GST tag fused to the SET domain of ATX1 (GST-SET) were assayed for their ability to bind a soluble CTD of Pol II fused to a His tag (His-CTD) and detected with antibody to the CTD of Pol II (Anti CTD). All experiments were repeated three times.
Figure 3.
Figure 3.
Binding of the ATX1-SET Domain or Endogenous ATX1 to Different Phosphorylated Forms of the CTD of Pol II. (A) Binding of soluble GST-SET or GST to bead-bound peptides containing four consensus CTD heptad repeats [(Y1S2P3T4S5P6S7)4] was measured. The 28mer peptides were either nonphosphorylated (Non-P), phosphorylated at Ser5P, or phosphorylated at Ser2P. The amount of GST or GST-SET protein bound to the peptides on the beads was determined by immunoblot analysis with antibody to GST (Anti GST). (B) Representative immunoblots of the proteins immunoprecipitated with nonimmune IgG serum (IgG IP) or antibody to ATX1 (ATX1 IP) and detected with antibodies to total Pol II (Anti Pol II), the Ser5P form of the CTD of Pol II (Anti Ser5P), or the Ser2P form of the CTD of Pol II (Anti Ser2P) are shown. All experiments were repeated at least three times.
Figure 4.
Figure 4.
ATX1 Affects the Amounts of TBP and Pol II Bound to Promoters and the Amount of mRNA Produced from ATX1-Regulated Genes. ChIP-PCR of the promoter regions of the indicated genes was performed with antibodies to TBP or the N-terminal region of Pol II (recognition of this region is independent of phosphorylation in the CTD region), or mRNA levels were measured, in wild-type or atx1 backgrounds. (A) A general gene representation indicating the promoter region and transcription start site (TSS) in the genes analyzed by ChIP-PCR with the indicated antibodies or nonimmune IgG (IgG). For each gene, the promoter region corresponds to region 1 in Figure 1A. (B) The amounts of DNA detected by ChIP-PCR analysis for TBP, total Pol II, or nonimmune IgG bound to the promoter regions are shown. (C) The relative transcript levels were determined in wild-type (WT) or atx1 rosettes of 20-d-old plant genotypes. All experiments were repeated at least three times. The bars represent the mean + se for representative experiments, n = 3 replicates. [See online article for color version of this figure.]
Figure 5.
Figure 5.
ATX1 and TBP Interact in Vivo, and TBP Is Localized to Promoters. (A) Nuclear extracts were immunoprecipitated with nonimmune IgG (IgG IP), ATX1 (ATX IP), or TBP antibodies (TBP IP). Immunoblots of the proteins immunoprecipitated by ATX1 antibody were analyzed with antibody to TBP (Anti TBP), while those immunoprecipitated by TBP antibody were analyzed with antibody to ATX1 (Anti ATX1). Representative immunoblots from three independent experiments are shown. (B) A diagram of the gene regions analyzed by ChIP-PCR with TBP antibody or nonimmune IgG (see Supplemental Table 2 online for primer sequences). (C) TBP or nonimmune IgG profiles of WRKY70 and LTP. The amount of DNA detected by ChIP-PCR, as a percentage of input DNA (y axis), is shown for each region. Experiments were repeated twice, and the bars represent the mean + se of a representative experiment, n = 3 replicates. [See online article for color version of this figure.]
Figure 6.
Figure 6.
Chemical Inhibition of CDK7/CDK9-Like Kinases Reduces ATX1, Ser5P, Ser2P, and H3K4me3 Levels within Target Genes. Mock-, Flavopiridol (Flap)-, or Seliciclib (Selic)-treated leaves were analyzed after 6 h of treatments. (A) The amount of specific proteins or protein modifications in nuclear extracts of mock- or inhibitor-treated samples was determined with the indicated antibodies. (B) A general representation of the gene regions analyzed by ChIP-PCR for the indicated antibodies or nonimmune IgG (IgG). The region analyzed for Ser5P, ATX1, H3K4me3, or IgG corresponds to region 2 for each gene, and the region analyzed for Ser2P corresponds to region 6 for WRKY70, region 5 for NCED3, or region 3 for LTP and ACT7 (see Figure 1A and/or Supplemental Table 2 online). (C) The genes analyzed by ChIP-PCR are shown above each panel with the antibody or IgG designated at the bottom of each panel. The treatment color key is at the bottom of the figure. (D) The levels of mRNA relative to rRNA were determined. rRNA was chosen as an internal control because rRNA genes are transcribed by RNA Polymerase I, which lacks a CTD and therefore should not be affected by the Flap or Selic inhibitors. Experiments were repeated three times. The bars represent the mean + se of a representative experiment, n = 3 replicates.
Figure 7.
Figure 7.
Inhibitors of CDK7/CDK9-Like Kinases Diminish ATX1 Binding within Genes but Do Not Lower ATX1 or TBP Levels at Promoters. The effects of genotype (wild type (WT) or atx1) or 6 h of treatment with mock or CDK7/CDK9 inhibitors (mock, Flap, or Selic) were analyzed by ChIP-PCR for changes in TBP or ATX1 occupancy on selected gene regions in leaves. The color key for the genotype or treatment is at the bottom of the figure. The gene name is shown above each panel, and the antibody or nonimmune IgG serum (IgG) used for ChIP-PCR is designated below the lanes. (A) The effects of mock, Flap, or Selic treatments on ATX1 profiles on the WRKY70, NCED3, LTP, and ACT7 genes. The numbers on the x axis show the gene regions analyzed and correspond to the regions diagrammed in Figure 1A. Region 1 corresponds to the promoter region of each gene. (B) The occupancy of TBP and ATX1 at the promoter region (region 1 in Figure 1A and/or in Supplemental Table 2 online) of three ATX1-regulated genes (WRKY70, NCED3, and LTP) and three genes not regulated by ATX1 (ACT7, TUB6, and ACT12). Experiments (A) were performed twice, and experiments in (B) were performed three times for WRKY70, NCED3, and LTP and twice for ACT7, TUB6, and ACT12. The bars represent the mean + se of a representative experiment, n = 3 replicates.
Figure 8.
Figure 8.
Model of ATX1 Interactions at Two Locations in Target Genes. A representation of an ATX1-dependent gene with its promoter (thick dark arrow) in a nucleosome-free region, and with the remainder of the gene complexed with nucleosomes (striped orange circles) containing H3K4me2 marks (me2), which are assumed to be the substrate for the trimethylating activity of ATX1 in this model, is shown. (A) TBP, ATX1, and Pol II participate in the formation of a protein complex at the promoter, wherein the interaction of ATX1 with the nonphosphorylated form of the CTD of Pol II and additional undefined ATX1 interactions help stabilize this complex. (B) Transcription elongation has moved Pol II to the +300-bp region of the transcribed gene, and Ser5 has become phosphorylated (red S in CTD consensus repeat YSPTSPS), recruiting ATX1 and facilitating trimethylation of H3K4 (me3) in this region. (C) Continued transcription elongation by Pol II changes the phosphorylation status of the CTD to Ser2P (red S in CTD consensus repeat YSPTSPS). ATX1 has been released from Pol II as it does not bind to the Ser2P form of CTD.

References

    1. Alvarez-Venegas R., Abdallat A.A., Guo M., Alfano J.R., Avramova Z. (2007). Epigenetic control of a transcription factor at the cross section of two antagonistic pathways. Epigenetics 2: 106–113 - PubMed
    1. Alvarez-Venegas R., Avramova Z. (2001). Two Arabidopsis homologs of the animal trithorax genes: A new structural domain is a signature feature of the trithorax gene family. Gene 271: 215–221 - PubMed
    1. Alvarez-Venegas R., Avramova Z. (2005). Methylation patterns of histone H3 Lys 4, Lys 9 and Lys 27 in transcriptionally active and inactive Arabidopsis genes and in atx1 mutants. Nucleic Acids Res. 33: 5199–5207 - PMC - PubMed
    1. Alvarez-Venegas R., Pien S., Sadder M., Witmer X., Grossniklaus U., Avramova Z. (2003). ATX-1, an Arabidopsis homolog of trithorax, activates flower homeotic genes. Curr. Biol. 13: 627–637 - PubMed
    1. Alvarez-Venegas R., Sadder M., Hlavacka A., Baluska F., Xia Y., Lu G., Firsov A., Sarath G., Moriyama H., Dubrovsky J.G., Avramova Z. (2006). The Arabidopsis homolog of trithorax, ATX1, binds phosphatidylinositol 5-phosphate, and the two regulate a common set of target genes. Proc. Natl. Acad. Sci. USA 103: 6049–6054 - PMC - PubMed

Publication types

MeSH terms