. 2010:1:137.
doi: 10.1038/ncomms1137.

Systems-wide temporal proteomic profiling in glucose-starved Bacillus subtilis

Affiliations
Free PMC article

Systems-wide temporal proteomic profiling in glucose-starved Bacillus subtilis

Andreas Otto et al. Nat Commun. 2010.
Free PMC article

Abstract

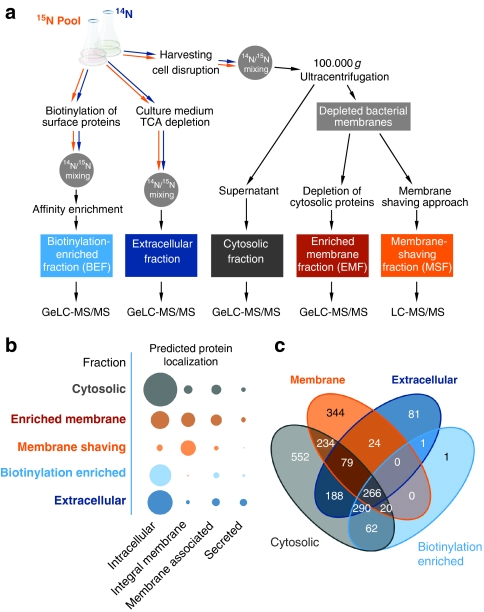
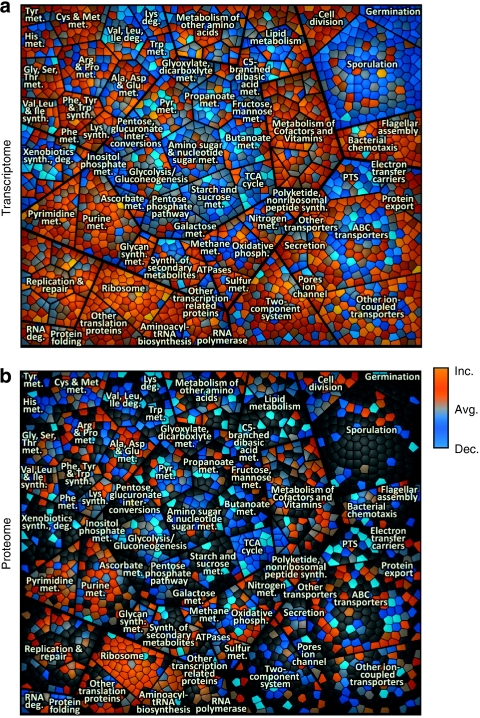
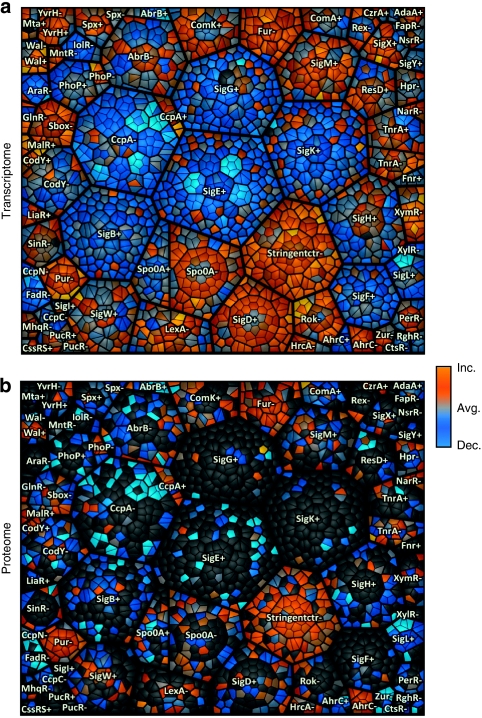
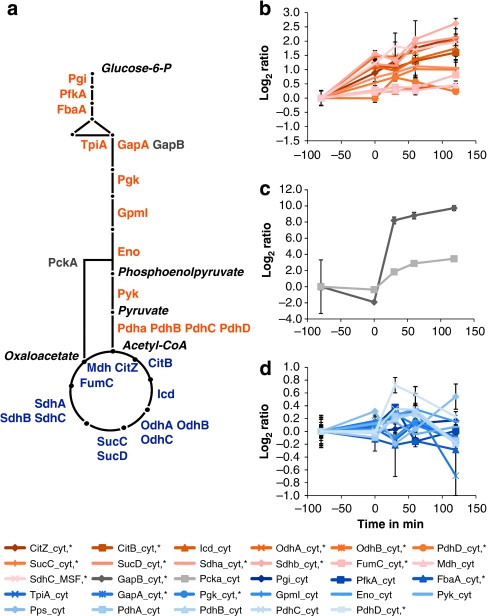
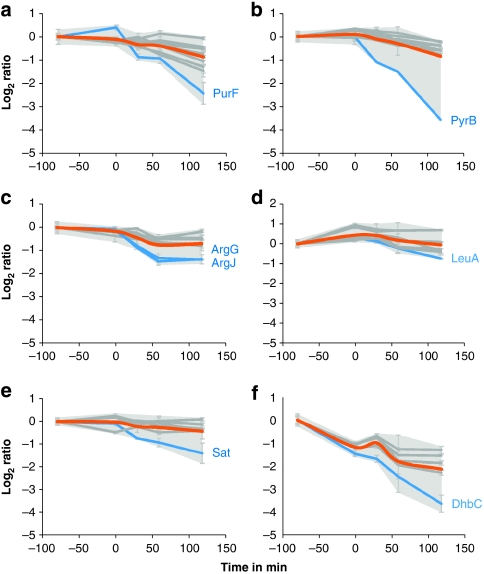
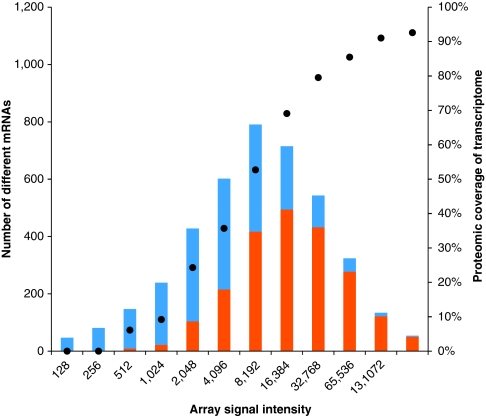
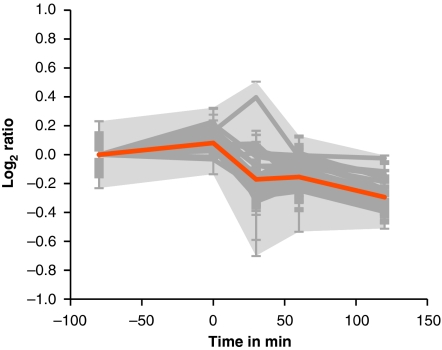
Functional genomics of the Gram-positive model organism Bacillus subtilis reveals valuable insights into basic concepts of cell physiology. In this study, we monitor temporal changes in the proteome, transcriptome and extracellular metabolome of B. subtilis caused by glucose starvation. For proteomic profiling, a combination of in vivo metabolic labelling and shotgun mass spectrometric analysis was carried out for five different proteomic subfractions (cytosolic, integral membrane, membrane, surface and extracellular proteome fraction), leading to the identification of ~52% of the predicted proteome of B. subtilis. Quantitative proteomic and corresponding transcriptomic data were analysed with Voronoi treemaps linking functional classification and relative expression changes of gene products according to their fate in the stationary phase. The obtained data comprise the first comprehensive profiling of changes in the membrane subfraction and allow in-depth analysis of major physiological processes, including monitoring of protein degradation.


Figures

Figure 1
Figure 1. Distribution of proteins identified according to the subfractionation workflow.
(a) Workflow of the proteomic experiment. The preparation of the five different subcellular fractions is exemplified with the most crucial steps. The starting point for all proteomic samples is the bacterial batch cell culture. The first crossroads is the separation between complete cells for the BEF (biotinylation-enriched fraction) aiming at the surface-exposed proteins, the cell culture medium for the extracellular proteins and cells for the cytosolic/membrane fractions. 14N/15N mixing depicts the stage in sample preparation, where mixing of the labelled pool and the unlabelled samples occurred. The earliest time point in experimental setup is chosen to minimize introduced effects by the labelling procedure to the quantitative data. Proteomic analyses (GeLC-MS and LC-MS) were performed with high-resolution and high mass accuracy mass spectrometry (2,142 total identified proteins with an FPR (false-positive rate) of 0.11% and 1.86 p.p.m. mass accuracy). (b) Distribution of proteins identified with a predicted subcellular localization in the different subfractions analysed. The area of the circles is proportional to number of identified proteins. (c) VENN plot of protein identifications in the different designated subcellular fractions. Numbers for the membrane fraction are summarized from EMF and MSF. Prediction of subcellular localization is according to Zhou et al. Loci of localization assigned were as follows: intracellular; integral membrane proteins (multitransmembrane, multitransmembrane (lipid-modified N termini)); membrane-associated proteins (lipid anchored, LPxTG cell wall anchored, N-terminally anchored (no cleavage site), N-terminally anchored (with cleavage site), C-terminally anchored (with cleavage site), intracellular/TMH start after 60); secreted (secreted via minor pathways (bacteriocin) (no cleavage site), secretory (released) (with cleavage site)).
Figure 2
Figure 2. KEGG-orthology treemap of growing B. subtilis.
(a) Gene expression of growing B. subtilis compared with average expression during the time course in cells entering the stationary phase. (b) Relative protein amount determined in cytosolic fraction of growing B. subtilis compared with the average protein amount during the investigated time course. Each cell in the graph displays a single gene locus that belongs to other functionally related elements in parent convex-shaped categories. These are again summarized in higher-level categories. Functionally related elements seem in close neighbourhood to each other. Gene functional data are based on KEGG-orthology (for example, main level (metabolism)/first sublevel (carbohydrate metabolism)/second sublevel/(glycolysis)). To visualize differences in expression level/protein amount compared with the average level colour coding was applied as following: blue—decreased level (dec.), grey—same level as average (avg.), orange—increased level (inc.). These figures are part of the time course analysis (Supplementary Movies S1 and S3), monitoring the changes from exponential growth to late stationary phase.
Figure 3
Figure 3. Regulon treemap of growing B. subtilis.
(a) Gene expression of growing B. subtilis compared with average expression during the time course in cells entering the stationary phase. (b) Relative protein amount determined in cytosolic fraction of growing B. subtilis compared with the average protein amount during the investigated time course. Each cell in the graph displays a single gene locus that belongs to other hierarchically/regulatory related elements in parent convex-shaped categories. These are again summarized in higher-level regulatory categories. Functionally related elements seem in close neighbourhood to each other. Treemap design is based on hierarchically structured regulatory data (black borders: regulon/thin black borders within the regulons: operon/smallest cells: gene). +/-; depict regulons being induced (+) or repressed (-;) depending on the regulator assigned to the area. To visualize differences in expression level/protein amount compared with the average level colour coding was applied as following: blue—decreased level (dec.), grey—same level as average (avg.), orange—increased level (inc.). These figures are part of the time course analysis (Supplementary Movies S2 and S4), monitoring the changes from exponential growth to late stationary phase.
Figure 4
Figure 4. Quantitative changes in proteins of the central carbon metabolism.
(a) Graphical representation of the central carbon metabolism. The main metabolic intermediates are italicized. (b) Change of protein amount for glycolytic enzymes. (c) Change of protein amount for gluconeogenic key enzymes. (d) Change of protein amount for TCA enzymes. Error bars indicate s.d. of the biological replicates (n=3).
Figure 5
Figure 5. Changes in proteins of the central carbon metabolism.
Changes in protein amount for proteins of selected biosynthetic pathways. (a) Members of the purine biosynthetic pathway (PurR; PurB; PurK; PurN; PurH*; PurM;PurD*; PurL*; PurQ*; PurC*; PurF*). (b) Members of the pyrimidine biosynthetic pathway (PyrK; Pyre; PyrC*; PyrF;PyrAA*; PyrD; PyrAB; PyrB). (c) Members of the arginine biosynthetic pathway (ArgC; ArgD; ArgF*; ArgH*;ArgB; CarB; ArgG*; ArgJ*). (d) Members of the leucine/isoleucine biosynthetic pathway (LeuC; LeuD; IlvC; LeuB*;IlvB*; IlvH*; LeuA*). (e) Members of the cysteine biosynthetic pathway (YtiB; YvgQ; CysH; YvgR; CysC; Sat*). (f) Members of the bacillibactin biosynthetic pathway (DhbA*;DhbB*; DhbE*; DhbF*; DhbC*). Log2 ratios are corrected for the first time point. Asterisks indicate proteins that are significantly altered as determined by analysis of variance (P-value<0.01). Error bars indicate s.d. of the biological replicates (n=3). Grey shading: area of maximal s.d. Orange: centroid of all proteins displayed. Blue: possible protease targets.
Figure 6
Figure 6. Comparison of identified proteins depending on the maximum transcript intensities.
The transcripts are binned according to their maximum array signal intensity over the whole time course. The number of genes belonging to the respective resembling group of transcript intensity is indicated in the bar chart in blue. Displayed in orange is the proportion of transcripts with accordingly identified translation products (proteins). The proteomic coverage of highly expressed genes is >90%, whereas for lowly expressed genes the coverage is significantly lower, as displayed with the circles on the y axis on the right side.
Figure 7
Figure 7. Change of protein amount for ribosomal proteins from the cytosolic fraction.
Relative quantitative changes for proteins belonging to the ribosome (YpfD; RpsL; RpsO; RpsJ*; RpmB; RpsP;*RpsD; RpsI; RpsH; RplD; RpsM*; RplB*; RpsE*; RpsF*; RpsR; RpsS; RpsG*; RpsT*; RplC*; RpmA; RplU*; RplR*; RplQ*; RpsQ*; RplE*; RplK; RpsB; RpmI; RplS*; RplF; RplI; RplX; RplW*; RpsK*; RplA*; RplP*; RplO*; RpsC; RplV*; RplT*; RplJ*; RplN*; RplL*; RplM*). Log2 ratios are corrected for the first time point. Asterisks indicate proteins that are significantly altered as determined by analysis of variance (P-value<0.01). Error bars indicate s.d. of the biological replicates (n=3). Grey shading: area of maximal s.d.s. Orange: centroid of all proteins displayed.

References

    1. Sonenshein A. L. & Hoch J.A.R.L. (eds). Bacillus subtilis and Its Closest Relatives: From Genes to Cells (American Society for Microbiology Press, 2002).
    1. Eiamphungporn W. & Helmann J. D. The Bacillus subtilis sigma(M) regulon and its contribution to cell envelope stress responses. Mol. Microbiol. 67, 830–848 (2008). - PMC - PubMed
    1. Koburger T., Weibezahn J., Bernhardt J., Homuth G. & Hecker M. Genome-wide mRNA profiling in glucose starved Bacillus subtilis cells. Mol. Genet. Genomics 274, 1–12 (2005). - PubMed
    1. Tjalsma H. et al. Proteomics of protein secretion by Bacillus subtilis: separating the "secrets" of the secretome. Microbiol. Mol. Biol. Rev. 68, 207–233 (2004). - PMC - PubMed
    1. Eymann C. et al. A comprehensive proteome map of growing Bacillus subtilis cells. Proteomics 4, 2849–2876 (2004). - PubMed

Publication types

Associated data