

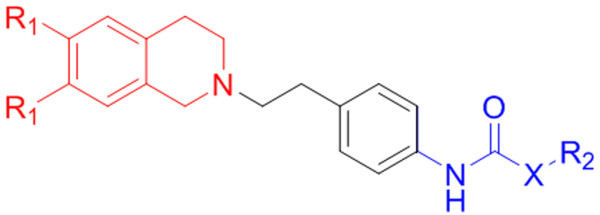
In silico quantitative structure-activity relationship studies on P-gp modulators of tetrahydroisoquinoline-ethyl-phenylamine series
- PMID: 21269449
- PMCID: PMC3038138
- DOI: 10.1186/1472-6807-11-5
In silico quantitative structure-activity relationship studies on P-gp modulators of tetrahydroisoquinoline-ethyl-phenylamine series
Abstract
Background: Multidrug resistance (MDR) is a major obstacle in cancer chemotherapy. The drug efflux by a transport protein is the main reason for MDR. In humans, MDR mainly occurs when the ATP-binding cassette (ABC) family of proteins is overexpressed simultaneously. P-glycoprotein (P-gp) is most commonly associated with human MDR; it utilizes energy from adenosine triphosphate (ATP) to transport a number of substrates out of cells against concentration gradients. By the active transport of substrates against concentration gradients, intracellular concentrations of substrates are decreased. This leads to the cause of failure in cancer chemotherapy.
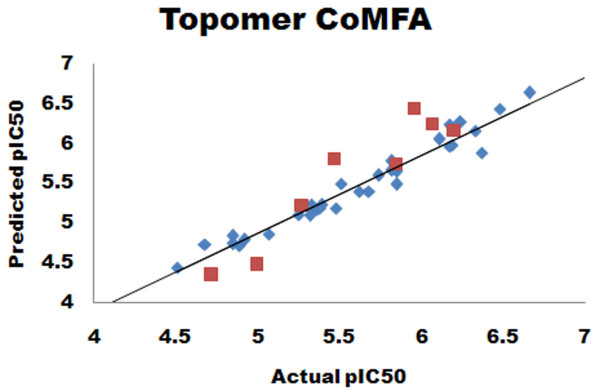
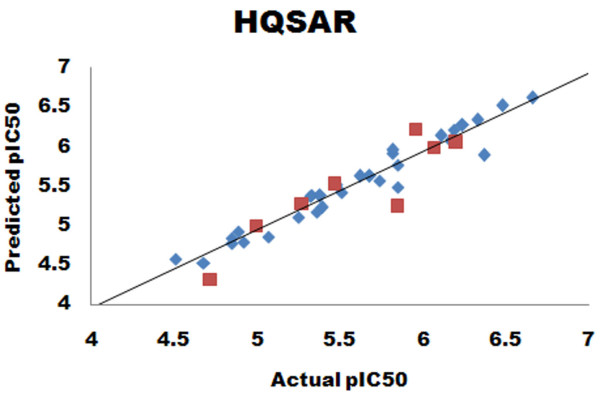
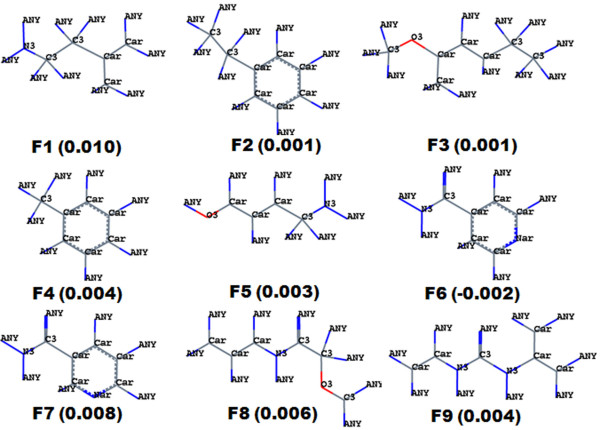
Results: Herein, we report Topomer CoMFA (Comparative Molecular Field Analysis) and HQSAR (Hologram Quantitative Structure Activity Relationship) models for third generation MDR modulators. The Topomer CoMFA model showed good correlation between the actual and predicted values for training set molecules. The developed model showed cross validated correlation coefficient (q2) = 0.536 and non-cross validated correlation coefficient (r2) = 0.975 with eight components. The best HQSAR model (q2 = 0.777, r2 = 0.956) with 5-8 atom counts was used to predict the activity of test set compounds. Both models were validated using test set compounds, and gave a good predictive values of 0.604 and 0.730.
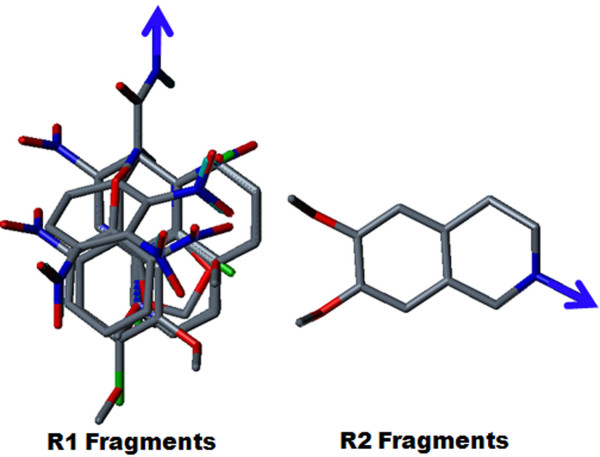
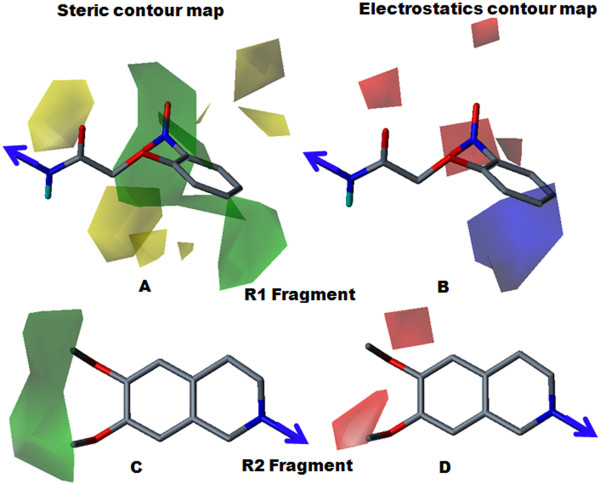
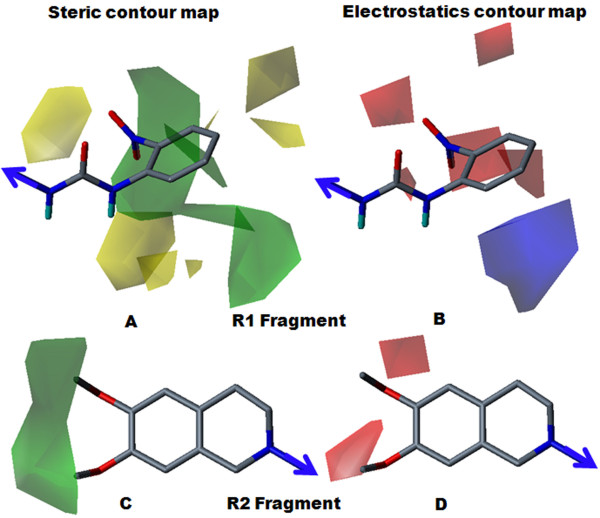
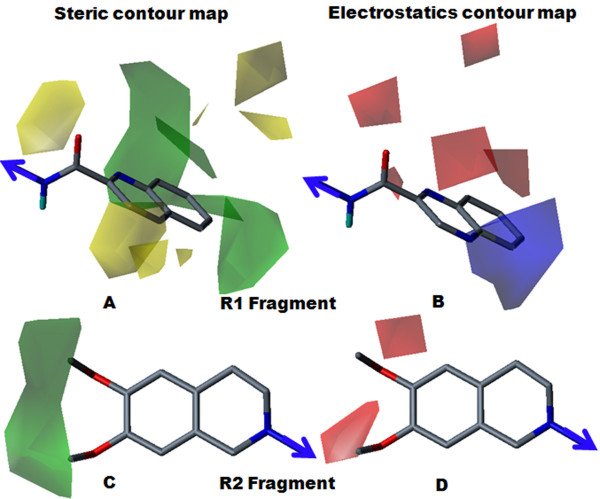
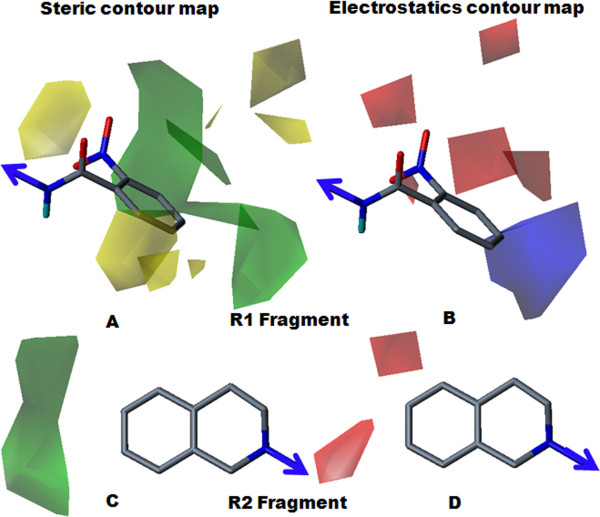
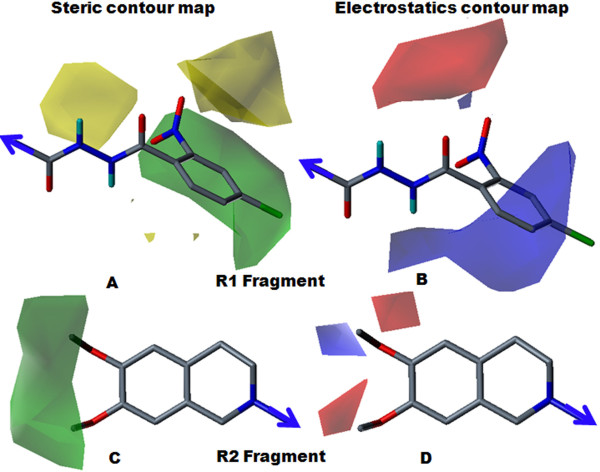
Conclusions: The contour map near R1 indicates that substitution of a bulkier and polar group to the ortho position of the benzene ring enhances the inhibitory effect. This explains why compounds with a nitro group have good inhibitory potency. Molecular fragment analyses shed light on some essential structural and topological features of third generation MDR modulators. Fragments analysis showed that the presence of tertiary nitrogen, a central phenyl ring and an aromatic dimethoxy group contributed to the inhibitory effect. Based on contour map information and fragment information, five new molecules with variable R1 substituents were designed. The activity of these designed molecules was predicted by the Topomer CoMFA and HQSAR models. The novel compounds showed higher potency than existing compounds.
Figures
References
Publication types
MeSH terms
Substances
LinkOut - more resources
Full Text Sources
Miscellaneous
